‘vnStat’ is a wonderful tool for monitoring your bandwidth usage. This article will show you how to use vnStat effectively. For bonus points, we’ll also look at ‘vnstati’ so you can make pretty graphs to visualize your bandwidth usage. This article shouldn’t take too long!
‘vnStat‘ stands for ‘view network statistics’ and has been around for like 18 years at the time of this writing. It’s so common that it has its own Wikipedia page. Of course you know that already, you can see the handy link I already provided!
Anyhow, ‘vnStat’ is a tool that runs in the terminal, a console tool as it helpfully describes itself:
vnstat – a console-based network traffic monitor
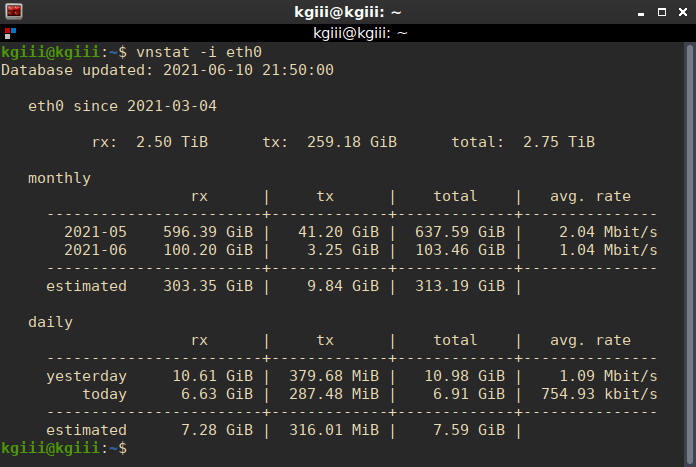
It’s a pretty great tool that generates some neat information and displays it in the terminal. It looks a little something like this:
That image should save me a whole bunch of time! I trust that my readers are smart enough to figure out the gist of it with just a handy screenshot. For those not fluent in the ways of vnStat, ‘rx’ means received and ‘tx’ means sent. The rest should be pretty easy to figure out.
In order to get vnStat, you have to actually have to install it. It’s available in the default repositories in the popular distros (and even the BSD family). If it isn’t, you can always build it from source. But, you can probably install it much like you’d install anything else. For example, in a distro that uses apt you’d install it with:
sudo apt install vnstat vnstati
(We might just as well install vnstati at the same time. Also, adjust that command for your own package management system.)
You can next go ahead and enable the service and start it next. That will be:
systemctl enable vnstat
systemctl start vnstat
Once it is installed, you should set up database(s) for vnStat. This is done with:
vnstat -u -i <device_name>
Where you have “<device_name>” you replace it with the name of your internet adapter. For example, lots of Ethernet adapters are ‘eth0’. You can find the name of your adapter(s) by using either ‘ifconfig -a’ or ‘ip addr’. You can repeat this with all the names of the internet adapters you use, if you do in fact use more than one.
Then you can verify your vnStat installation with:
vnstat -v
Assuming that spits out a version number you should be good to go.
So, by now you should have vnStat installed, and its sister app vnstati should also be installed. Let’s examine how you use them.
First, you can just call the application in the terminal. There’s nothing complicated about it and it may be your choice if you have more than one network interface. To do so, it’s just:
vnstat
You can also be more specific, getting the data for just a single device:
vnstat -i eth0
Where ‘eth0’ is, change it to the name of your device. So, for a wireless device, it may look something like:
vnstat -i wlxe4beed0e5f5c
There are a ton of other options, so be sure to check the man page. Those are the options that I use most often, so those are the only ones we’ll be concentrating on.
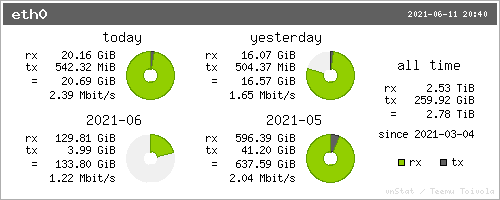
Now, you can also use vnstati to make a nifty graphic that will show you your bandwidth usage. It looks a little something like this:
That’s the output of this command:
vnstati -s -i eth0 -o ~/Pictures/bandwidth.png
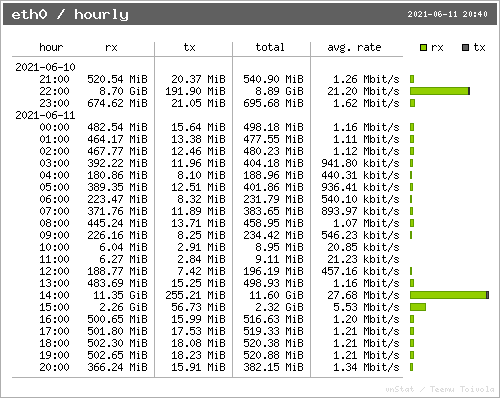
As you can guess, you can change the output path to anything you want (and have permissions for). I prefer that particular graphic, but there are a ton of options and you can gather all sorts of information. For example, there’s also this to show the hourly rate from the past 24 hours:
That is the output from this command:
vnstati -h -i eth0 -o ~/Pictures/bandwidth1.png
And, again, you can modify the outputted .png to place it where you want. There are a whole lot more options and this article isn’t going to cover them all. That’s not the kind of article I write. There are tons more options in the man page, if you want to explore them.
man vnstati
Find what works for you and run with it. You should be able to find a format you like that has the information you’re looking for. I’m just introducing you, you decide how you use it.
And there’s another article in the books! This one explains vnStat and vnstati. Both are pretty great tools that go well together, and they help you monitor your bandwidth usage. If you have any questions or comments, feel free to scroll down and leave a message.
Thanks for reading! If you want to contribute, you can donate, you can write an article, you can register to help, you can buy inexpensive hosting, you can rate the articles, you can scroll down to sign up for the newsletter, or you can share this site on social media. If you can think of anything else to help, jump right in and start doing it!
Today's article isn't going to be complicated or long as we are going to cover…
We've had a run of Python packages recently and you can tell that I'm a…
The title is the best I can come up with to describe this exercise as…
It was suggested that I write an article about journalctl, which seemed like a large…
Today we will have a fairly simple exercise as we're going to just use a…
I have not done a meta article lately. I don't find them interesting to write…