There are any number of tools out there to monitor your system and today we’ll cover the ‘htop’ system monitor. This htop application is a pretty solid application and one that you might want to be familiar with. So, let’s learn about htop…
First, your Linux desktop comes with a system monitor called ‘top‘. This is true for so many distros that we might as well accept it as fact. The top application has been around 40 years at the time of this writing and it stands for ‘Table Of Processes’.
The top application is a task manager and system monitor, allowing you to manage processes while also monitoring system resources. You can learn a lot from top, such as uptime, RAM use, CPU use, the number of running processes, and so much more…
top:
If you want, you can open top with the following command:
1 | top |
(You can just press
The output should look a little like this:
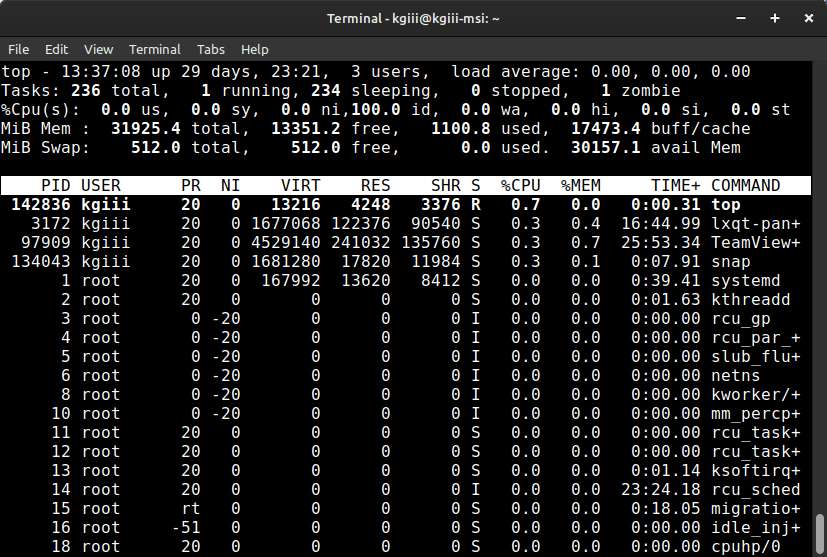
The man page describes the top application as:
top – display Linux processes
The man page for the top command will also explain that you can do the following with it, which you may find interesting.
1 2 3 4 5 6 7 8 9 10 11 12 13 14 15 16 17 18 19 20 21 22 23 24 25 26 27 28 29 30 31 32 33 | 1. COMMAND-LINE Options 2. SUMMARY Display a. UPTIME and LOAD Averages b. TASK and CPU States c. MEMORY Usage 3. FIELDS / Columns Display a. DESCRIPTIONS of Fields b. MANAGING Fields 4. INTERACTIVE Commands a. GLOBAL Commands b. SUMMARY AREA Commands c. TASK AREA Commands 1. Appearance 2. Content 3. Size 4. Sorting d. COLOR Mapping 5. ALTERNATE-DISPLAY Provisions a. WINDOWS Overview b. COMMANDS for Windows c. SCROLLING a Window d. SEARCHING in a Window e. FILTERING in a Window 6. FILES a. PERSONAL Configuration File b. ADDING INSPECT Entries c. SYSTEM Configuration File d. SYSTEM Restrictions File 7. STUPID TRICKS Sampler a. Kernel Magic b. Bouncing Windows c. The Big Bird Window d. The Ol' Switcheroo |
As you can see, top is pretty versatile.
So then, what is htop?
htop:
The name is htop simply because the author’s name is Hisham. It is otherwise similar to the top application but comes with some great benefits. Another great benefit is that htop is going to almost certainly be available for your distro. Some distros have started installing htop by default.
Why htop instead of top?
Well, for starters the layout is much nicer. You can also use your mouse to control htop. This includes scrolling, making it easy to navigate. You can kill processes like this, change their nice value, and more. Additionally, you can even kill multiple processes at the same time.
You can filter and search easily with htop, meaning you can narrow down the results and keep it easier to read. On top of that, htop has a cascading tree layout for the processes.
I’m told that htop is quicker due in part to how it gathers the information but I have no way to verify this. Both applications seem reasonably quick to me, but that’s what they tell me. I believe this has something to do with being ncurses-based.
You’ll also click the setup option and configure htop to your needs. It has a nice colorful layout that is quite intuitive. Filtering is also easy, as is searching. Those both come in handy when you want to kill some processes all at once.
If you’re curious, htop looks like this:
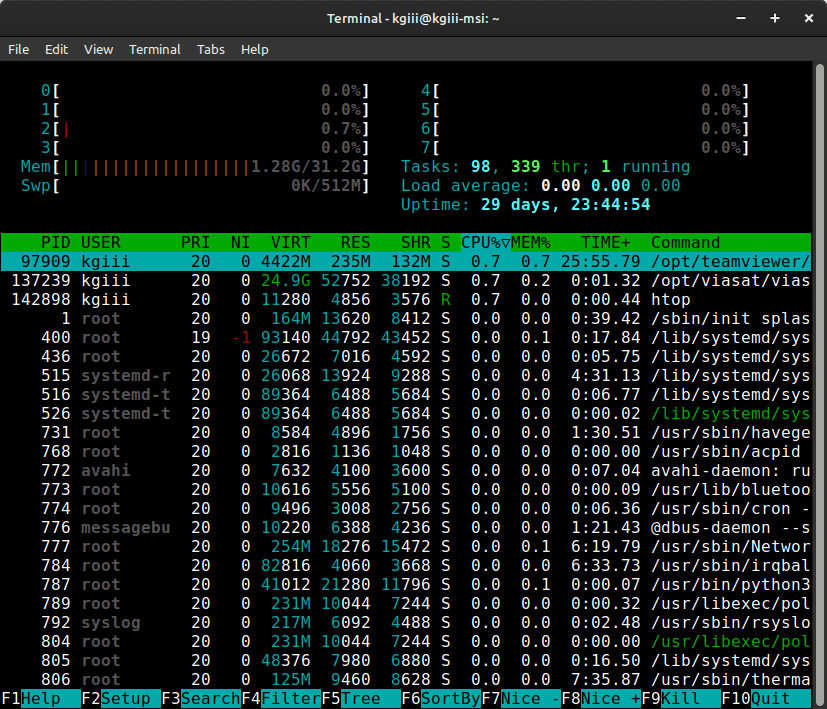
There are times when you can’t access your GUI system monitor to clear out frozen processes or things like that. So, you should get used to either top or htop. I think you’ll find htop is more featureful and useful in modern times. Even if you can’t use a mouse at the time (say you’re in a TTY), htop is still easy to operate, which is nice.
Install htop:
As I mentioned above, some distros (like Ubuntu) now include htop by default. There are older versions of Ubuntu out there that are still supported, so I’ll include htop installation instructions for them. Then again, they’d be the same instructions used by Debian, so it wouldn’t be that hard to figure out.
For simplicity’s sake, let’s install htop with the terminal. That’s a fairly universal thing. Most of the time, you can open your terminal by pressing
With your terminal open, use the correct command for your package manager:
Debian/Ubuntu/etc:
1 | sudo apt install |
SUSE/OpenSUSE/etc:
1 | sudo zypper install htop |
Fedora/etc:
1 | sudo dnf install htop |
Rocky/Alma/etc:
1 2 | sudo yum install epel-release sudo yum install htop |
Arch/Manjaro/etc:
1 | sudo pacman -S htop |
One of those should work for you.
The syntax to use htop is just this:
1 | htop |
There aren’t a bunch of flags to worry about, but it’s worth checking the man page:
1 | man htop |
If you’re going to learn anything from the man page, you might want to learn the keyboard shortcuts for when you do need to use htop without a mouse. There are many, but learning the basics will take you ten minutes. I’d call that ten minutes that were properly invested because htop is a great application.
There you have it.
You should now have htop installed and know how to run the application. I think you’ll like it more than you liked top. I know I do. It’s definitely what I prefer of the two – but it’s not the only option.
Closure:
I’ve wanted to write this article for a while but just didn’t want the hassle of writing it. I finally had both time and motivation, so I wrote the article. There’s some chance that a major storm is going to take out my internet, so I might as well leave you with a good article to keep you going. Now you know about htop, a top replacement. That’s a good thing.
Seriously, I prefer htop over top. It’s just much nicer and easier to work with. Be sure to check the setup options because you can configure htop to your liking. That’s a handy feature to have.
Thanks for reading! If you want to help, or if the site has helped you, you can donate, register to help, write an article, or buy inexpensive hosting to start your site. If you scroll down, you can sign up for the newsletter, vote for the article, and comment.