If you’ve used hardinfo in the past, it may interest you to know that hardinfo has been rebooted as hardinfo2. This is just a quick ‘news’ article and won’t take up much of your time. It’s worth reading, however!
So, I wrote this some time ago:
Graphically Examine Hardware Info With HardInfo
I assume that’s how user ‘hwspeedy’ found this site and they sent me an email letting me know that hardinfo (no caps, I guess) has been rebooted as hardinfo2. That piqued my interest.
hardinfo2:
I looked and the project appears to have a dozen or so people behind it. That many people is a good start, which made me optimistic You can view the hardinfo2 project page here at the following link:
The original, hardinfo, hadn’t had any recent updates. These folks rebooted it. Their goal is to get hardinfo2 into all the distros and they’re 60% of the way there. I’m impressed enough to go ahead and write about it here.
The two major changes are the theme aspect, which I found silly and it made the text impossible to read on this system. Fortunately, you can turn it off. The second major change is the ability to upload your benchmarks. You can see how your system compares to others.
They have releases for pretty much every major version of Linux. See here:
I had hardinfo installed and hardinfo2 didn’t want to install. So, I purged hardinfo from my system with the following command:
1 | sudo purge hardinfo |
I was then able to install hardinfo2. I did so with gdebi.
With the new version installed, I was quickly able to click on View > Themes > Disable Theme. That made it so that I could make out what was going on. Otherwise, it looked like this on a Linux Mint system:
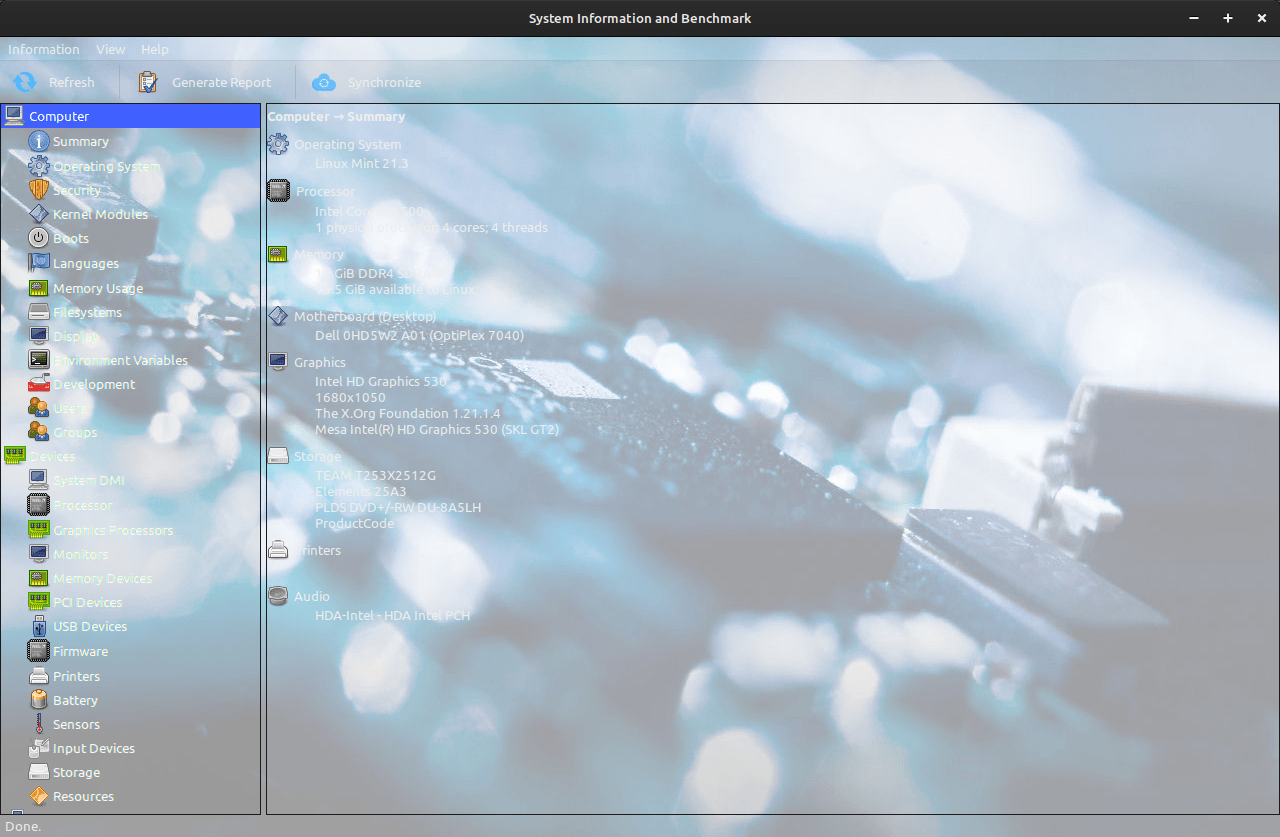
This is just my refurbished PC that runs Linux Mint, so it’s nothing special. Even if it was, you wouldn’t know until you disabled themes.
Here it is with the themes disabled:
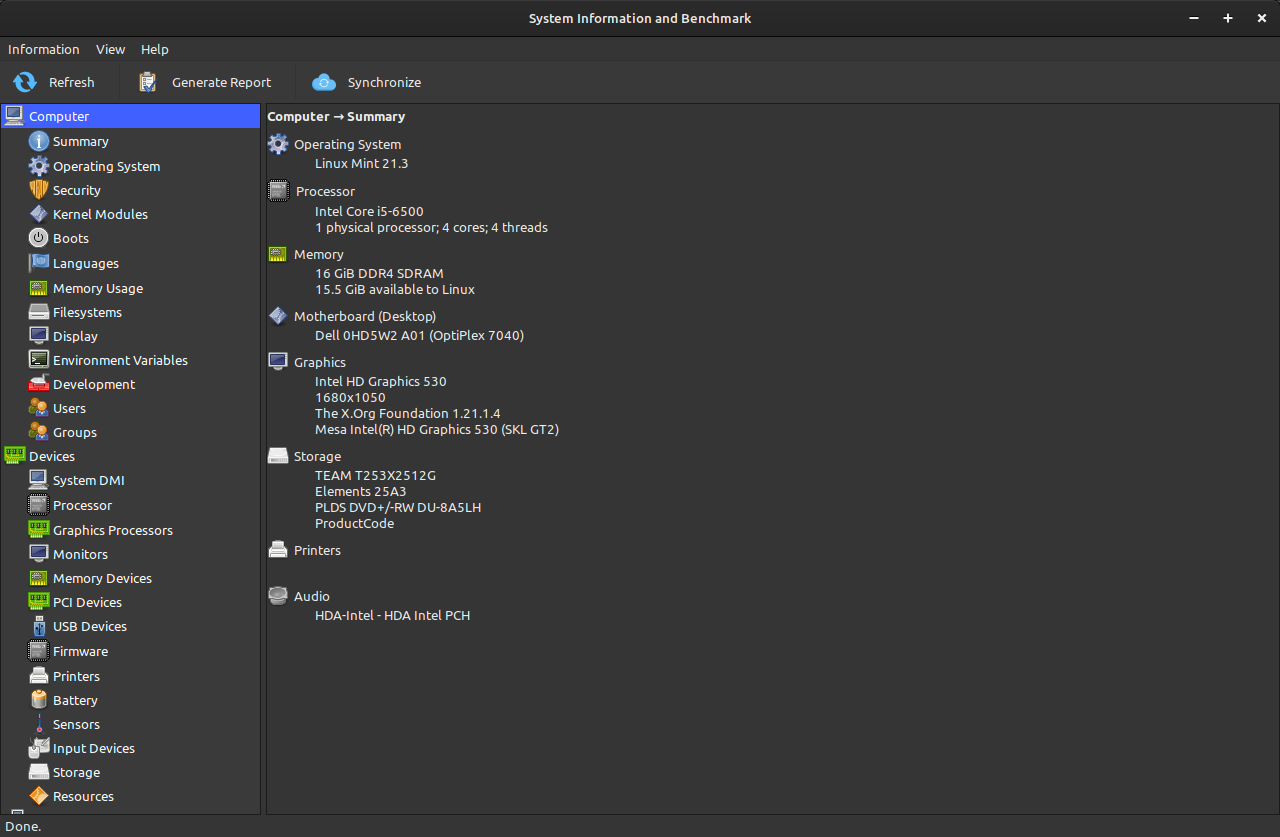
I went through the list and even did the benchmark thing. Things mostly seem to work. Some of the benchmarks didn’t show my level in the results, but that’s possibly just a teething issue.
This is useful if you need support – just click on Generate Report. You can generate a report to share with the forums when asking for support.
This is also useful for bragging rights – just click on Synchronize. You can see how you rank, and share it, against other users. As they’re now modern results, you probably won’t be dominating all the benchmarks as you did with the older hardinfo.
I have high hopes for these new developers. After I saw their email, I figured I’d share that information with you. I ignore most of that stuff but this is an application that I’ve used time and time again. It’s also an application that I’ve recommended. Seeing some people pick up and run with the task makes me happy. I wish them the best of luck.
I will point out that the sync button uploads a bunch of information. You can pick and choose what you upload; nothing nefarious is going on there. It’s simply a system-gathering (and benchmarking) tool and nothing more.
Closure:
Well, there’s not much more to cover. It still does the basic tasks as listed in the first article, it’s just now got some new features and is now being actively developed. It’s good to see some of the old tools being used and it’s good to see people acting when they see a lapse in the system. Without them, we’d not have much of an operating system.
So, thanks!
Thanks for reading! If you want to help, or if the site has helped you, you can donate, register to help, write an article, or buy inexpensive hosting to start your site. If you scroll down, you can sign up for the newsletter, vote for the article, and comment.