Today we’ll cover one way to enable or disable your network interface in the Linux terminal. We will cover enabling and disabling your network interface, so you might want to keep this in mind.
If you have multiple network interfaces, you might want to disable one of them. You might want to disable networking to keep a computer offline. There are many reasons why you’d want to enable or disable your networking.
This isn’t a very complicated process, so it won’t take too long.
The command we’ll be using, and we’ll be using it twice, is the ‘ip’ command.
The ‘ip’ Command:
If you’ve got a modern Linux desktop (or server), you’ve got access to the ‘ip’ command. It’s a relative newcomer in the space but it’s pretty universal at this point.
That’s it. That’s the only tool (other than ‘sudo’) we’ll need for the job. You can verify that ‘ip’ is installed with this command:
1 | which ip |
The output should match:
1 2 | $ which ip /usr/sbin/ip |
If you check the man page, you’ll see why this is the correct tool for the job:
ip – show / manipulate routing, network devices, interfaces and tunnels
We’ll use the command with a couple of different ways to enable and disable your network interface. It’s not terribly complicated.
Enable/Disable Your Network Interface:
Yes, the ‘ip’ command is used in the terminal. That means you’ll need an open terminal. Just press
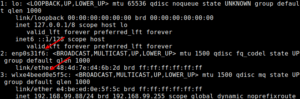
With your terminal open, your first step is to identify the network interface:
1 | ip addr |
That should look something like this:
With that information, the syntax to disable a network connection is simple.
1 | sudo ip link set <interface_name> down |
For example:
1 | sudo ip link set enp0s31f6 down |
If you’ve disabled the device, it’s just as easy to enable it. The syntax is:
1 | sudo ip link set <interface_name> up |
An example would be:
1 | sudo ip link set wlxe4beed0e5f5c up |
See? It’s pretty easy to enable or disable your network interface.
Closure:
If you need to enable or disable your network interface you now know how. That’s a handy thing to know as folks have inadvertently disabled their network interface. This enables it if you did. This also disables your network interface if you’d rather.
Thanks for reading! If you want to help, or if the site has helped you, you can donate, register to help, write an article, or buy inexpensive hosting to start your site. If you scroll down, you can sign up for the newsletter, vote for the article, and comment.