Today is one of those days when I’d like to introduce you to new software as we learn to monitor system resources with “Resources”. That may not make much sense, but it will! The Resources application is a great option if you want a great way to monitor system resources.
I may do a few articles about monitoring system resources. That’ll be fun.
It’s probably important to mention that many of you will not have this in your default repositories. For those who do, it won’t be in the typical repositories but will exist because your distro ships with Flatpaks enabled.
That’s right. To use this article, you should read a previous article:
Once you get Flatpak installed and the FlatHub repository added, you can use a great application known as Resources.
Of course, your desktop distro shipped with a GUI resource monitor and it’s usually fit for purpose. However, this Resources application has a bunch of great features and it is easy to live with.
Another great thing is that this shouldn’t be a very long article…
Monitor System Resources:
Once Flatpak is installed, you might want to keep your terminal open. Yes, Flatpaks are large – but they have great features, including running in isolation and shipping with all their dependencies.
Most of you can open a terminal by pressing
With your terminal open, you can install Resources quite easily:
1 | flatpak install flathub net.nokyan.Resources |
That should add Resources to your application menu. It will fall under the Administration sub-section. I’ve seen some distros not show newly added Flatpaks in the menu until after a reboot. If that’s the case, you can manually run Resources with this command:
1 | flatpak run net.nokyan.Resources |
Once you open the application, all will be revealed. Here’s an image:
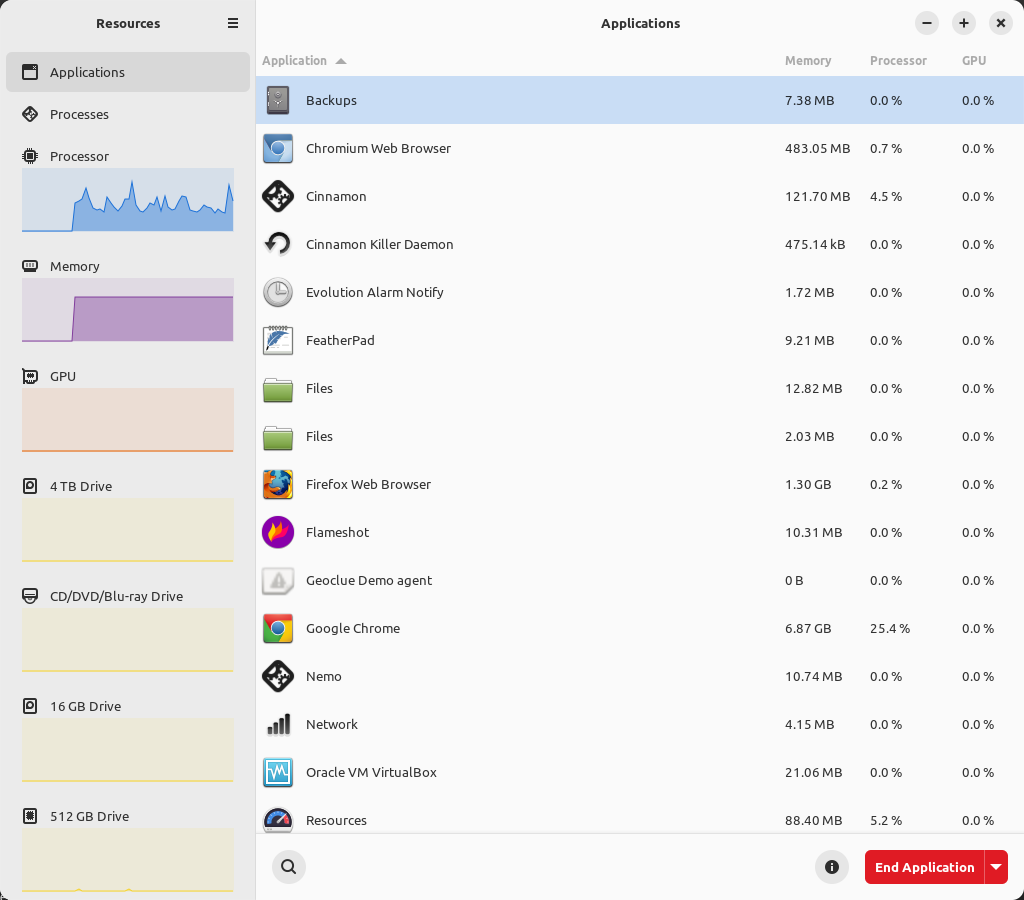
One of the great things is that you can monitor applications that might have multiple processes – such as Google Chrome. You can also monitor processes individually, including closing those applications and processes.
Additionally, you can monitor CPU use, memory use, GPU use, and your various storage devices – including optical media. If you want to know read and write speeds on the fly, that information is available in an easily understood graphical tool.
That’s right… I’m covering a graphical tool today! Let it be said that a GUI is sometimes a good tool for the job and that the Resources application is one of those tools.
If you click on the hamburger menu near the top, you can also adjust your preferences. You can choose to display more information than the default and adjust how you’d like to read things like temperature values. It’s a pretty handy application.
Yes, you already have a GUI tool to monitor system resources but you can opt to use this one instead. It’s a pretty large file (or multiple files) but that’s to be expected with Flatpaks. So, get a coffee going while you wait for the application to install.
Closure:
So, there’s a GUI tool you can use to monitor system resources. It’s worth investigating. Some of you may like it well enough to switch to it entirely. Others may find they reach for it when they need more information than they usually have available on one screen. Either way, it’s a handy application and one worth knowing about.
Thanks for reading! If you want to help, or if the site has helped you, you can donate, register to help, write an article, or buy inexpensive hosting to start your site. If you scroll down, you can sign up for the newsletter, vote for the article, and comment.