Most of us use USB devices regularly, even using USB thumb drives to install Linux, and today we’ll learn how to monitor USB bandwidth. What we don’t tend to do is monitor the bandwidth of our USB devices. Today, we’ll be doing that and just that. It shouldn’t be a long article.
When I say bandwidth, you could also say throughput, I speak of the speeds at which data moves from one place to another. In this case, it’s the speeds supported by your USB devices.
When you move data from one place to another, it does so at various speeds. These days, you have better speeds with USB devices, now that we have USB 3.1 and USB C. Those are pretty speedy.
If you don’t know, USB stands for Universal Serial Bus and USB has been around since 1996. There are a number of standards for transferring things across the bus lines and USB is just one of them. USB is a ratified standard that gives us uninversal connections shared among manufacturers. There’s even USB4 that I’m entirely unfamiliar with.
I suppose I don’t really need to explain this. We all understand USB well enough, I’d think. Still, we may not know some of the details and we may have never thought about monitoring USB bandwidth. Well, that’s what we’re doing and we’ll be doing it in the terminal.
What will we be using?
usbtop:
We’ll be using a nifty application known as ‘usbtop’ for this exercise. While there’s a tiny bit more to it than we’ll cover, we’ll at least use it to monitor USB bandwidth. If the ‘top’ aspect looks familiar, it should. This usbtop is familiar in the sense of top, htop, or atop. All of which are applications I should cover but haven’t. If you’re already familiar with those, you’ll have the right sort of expectations.
The usbtop application runs in the Linux terminal. I know that it’s available for more than just the Ubuntu family, but I’ll be testing this in Linux Mint. That’s just the device I’m using at the moment, though I’d normally be using Lubuntu.
If you’re using Linux Mint (or Debian, Ubuntu, Lubuntu, or even ElementaryOS) you can install usbtop easily. I had to refer to the Arch AUR page for this article, so I’m sure this is available elsewhere – though I think it might be in AUR for Arch derivatives like Mandriva.
But, seeing as we’re using Linux Mint, you can install usbtop with this command:
1 | sudo apt install usbtop |
(Don’t try running it just yet. It won’t work properly.)
Once installed, you can type man usbtop to read the manual but that doesn’t appear to do a darned thing. No, I do not know why. If you want, you can try something like gibberish – like usbtop -help which won’t actually work but will be kind enough to spit out the two options you have with this usbtop application.
Monitor USB Bandwidth:
Well, I’ll assume you were able to run the installation command above. It’s run in the terminal. If you go this far, you didn’t need help opening the terminal. See? You’re getting better with this Linux stuff already!
Now, it’s not going to run. Feel free to try it. If you try, it will spit out an error that looks remarkably similar to this:
No USB bus can be captured thanks to libpcap. Check your name filter and make sure relevent permissions are set !
Don’t blame me. I’m just the messenger. Instead, start with this command:
1 | sudo modprobe usbmon |
Now you can run the following command:
1 | sudo usbtop |
Yes, you want elevated permissions to run usbtop.
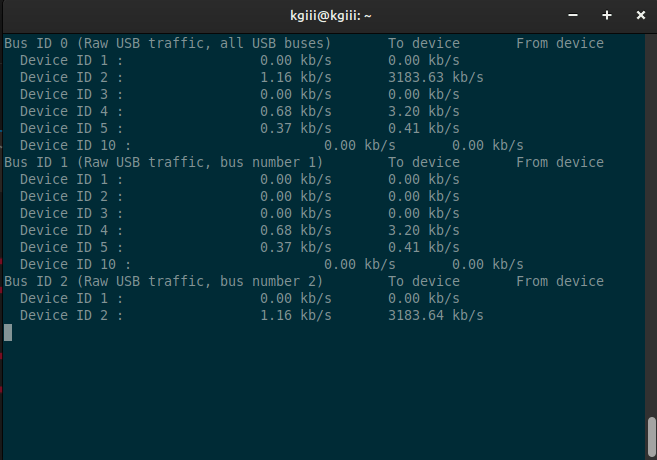
With usbtop now up and running, you can try transferring something to a USB drive, or something from one USB drive to another USB drive, or anything involving your USB drive. You can even start up a USB webcam and monitor the bandwidth that uses.
I took a crappy screenshot… You’re welcome!
If you want to exit that screen, press
Nah, it’s a perfectly usable application. It doesn’t do much. You can expect it to do what it says and just what it says. If you checked the fake help page above, you’ll see that you can monitor a single device and you can list the devices. Those can be monitored individually, but you might as well monitor USB bandwidth on all the devices at once. It’s not too confusing, I swear.
Closure:
Well, now you know how to monitor USB bandwidth. I’m sure the application is available for other distros, but I did not test that. If you do test that, feel free to leave comments so that other people can learn from your labor. It’s a community, so share the wealth of knowledge in a comment.
I promise, it won’t be used as a way to spam you. I’ve been almost 500 articles and I’ve never spammed anyone so far – even with hundreds of comments and a bunch of people signed up to the newsletter. I just don’t see me violating that trust. If I ever do have a commercial message, it’ll just get attached to the newsletter – like a sponsor or something like that.
Thanks for reading! If you want to help, or if the site has helped you, you can donate, register to help, write an article, or buy inexpensive hosting to start your site. If you scroll down, you can sign up for the newsletter, vote for the article, and comment.