Today’s article is going to tell you how to use Nethogs to monitor network usage on a per-application basis. It’s actually easier than one might think and we’ll even show you how to install Nethogs on a variety of distros.
Why would you want to monitor this? Well, you may want to know which applications are eating up most of your bandwidth. Not everyone has unlimited bandwidth after all. You might also be looking for rogue applications/malware that’s using up some of your bandwidth. There are all sorts of reasons to monitor your network usage at this level. Feel free to leave a comment telling us how you intend to use Nethogs.
As stated, we’ll be using Nethogs. The man page describes it as:
nethogs – Net top tool grouping bandwidth per process
I suppose that’s mostly useful to those who know what ‘top‘ is. (There’s a future article about top and htop, when I get to it.) But, Nethogs is like a system monitor, except it’s a network monitor with some visual similarity with top. (Yes, that’s an ugly, ugly sentence.)
We’ll be using ‘sudo’ for all of these commands. It’s possible to use Nethogs without sudo, but we won’t be covering that here. If that’s something you’re interested in doing, a search engine will help you get there.
Monitor Network Usage:
Nethogs is a terminal-based application. As such, you’ll need an open terminal. Just press
Once your terminal is open, you can go ahead and install Nethogs. Pick the command that works with your system’s package manager.
Debian/Ubuntu:
1 | sudo apt install nethogs |
RHEL/CentOS (will need to enable EPEL):
1 2 | yum install epel-release yum install nethogs |
Fedora:
1 | dnf install nethogs |
Arch/Derivatives:
1 | sudo pacman -Sy nethogs |
Once you have Nethogs installed, you can check the help files. In this case, the help files are better than the man files (I think) so just enter the following into your terminal:
1 | nethogs -h |
Now, to run Nethogs, we’ll use sudo and just run it in the terminal. Believe it or not, this mode is generally just fine for anything you’re going to do.
1 | sudo nethogs |
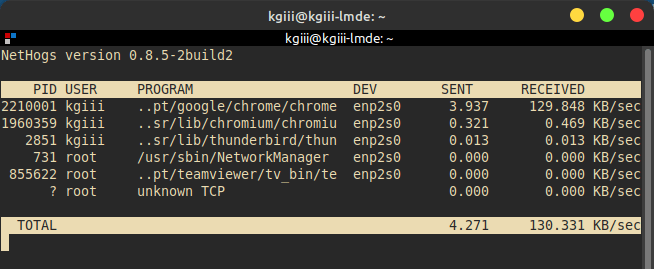
That’ll open Nethogs and start monitoring your network usage on a per-application basis. It looks something like this:
Now, if you’re going to leave it open, you can change the refresh rate. That’s done with the -d <seconds> flag. If you want it to refresh every 15 seconds, your command would look like this:
1 | sudo nethogs -d 15 |
By the way, if you want to exit Nethogs, you just press
If you want, you can specify the network interface you want to use. It doesn’t require any flags, just the network interface name. (Read Also: how to change your network interface name.) An example of that command would be:
1 | sudo nethogs enp2s0 |
While the application is running, you can do some sorting/display changes with the
Closure:
And there you have it! You have another article to read. This one is about monitoring your network usage on a per-application basis, a pretty handy skill/tool to have. It’s pretty easy and the output is clear enough for all but the newest Linux users. If you find the tool useful, or already use the tool, please feel free to comment.
Thanks for reading! If you want to help, or if the site has helped you, you can donate, register to help, write an article, or buy inexpensive hosting to start your own site. If you scroll down, you can sign up for the newsletter, vote for the article, and comment.