Today’s article is a fun one, an article where you’ll learn how to visualize your traffic with darkstat. It’s a fun little tool that lets you graphically visualize your network traffic in your browser. While it’s likely more of an enterprise-level tool, there’s no reason you can’t use it as a home user.
So, if you’d like to learn how to visualize your traffic with ‘darkstat‘, read on and I’ll do my best to explain it.
There’s a lot to the tool, but darkstat defines itself in the man page as:
darkstat – network statistics gatherer
We’ll only be using darkstat to visualize your network traffic in the browser, but there are quite a few options available. You’ll want to check the man page after you’ve got darkstat installed and have learned its basic usage.
I’ve previously covered tools like VNstat, which lets you monitor your bandwidth usage. You can even helpfully draw some graphs with the tool. This is quite different. You’ll see…
Visualize Your Network Traffic With ‘darkstat’:
This article requires an open terminal, like many other articles on this site. If you don’t know how to open the terminal, you can do so with your keyboard – just press
First, you need to install darkstat. It should be in your default repositories for many of you. To save time, I’ll show you how to install it in Debian/Ubuntu-based distros. Just adjust the command to suit your system’s package manager:
1 | sudo apt install darkstat |
With darkstat now installed, you need to start it – so that it monitors your network traffic. To do that, you’ll need to know the name of your network interfaces. It just so happens that I wrote that article last time:
How To: Show Your Network Interfaces
Armed with that data, you want to start darkstat and the format is:
1 | sudo darkstat -i <network_name> -p <port_number> |
So, for example, you might end up with one of the following commands:
1 | sudo darkstat -i enp2s0 -p 8080 |
Or maybe this type of command for a wireless connection:
1 | sudo darkstat -i wlxe4beed0e5f5c -p 8080 |
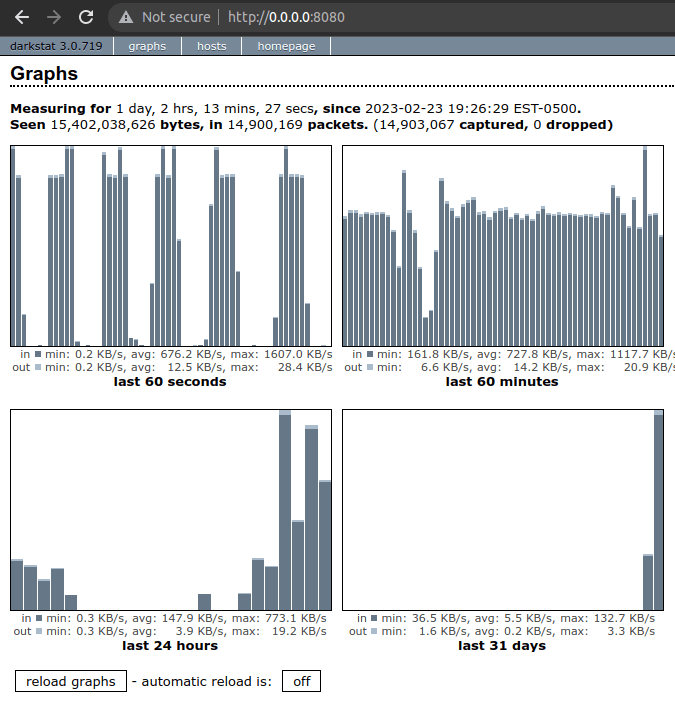
After running that command, you’ll then want to open the following URL with your preferred browser:
http://0.0.0.0:<port_number>
If you used the port above, you’d connect to:
The results should look something like this:
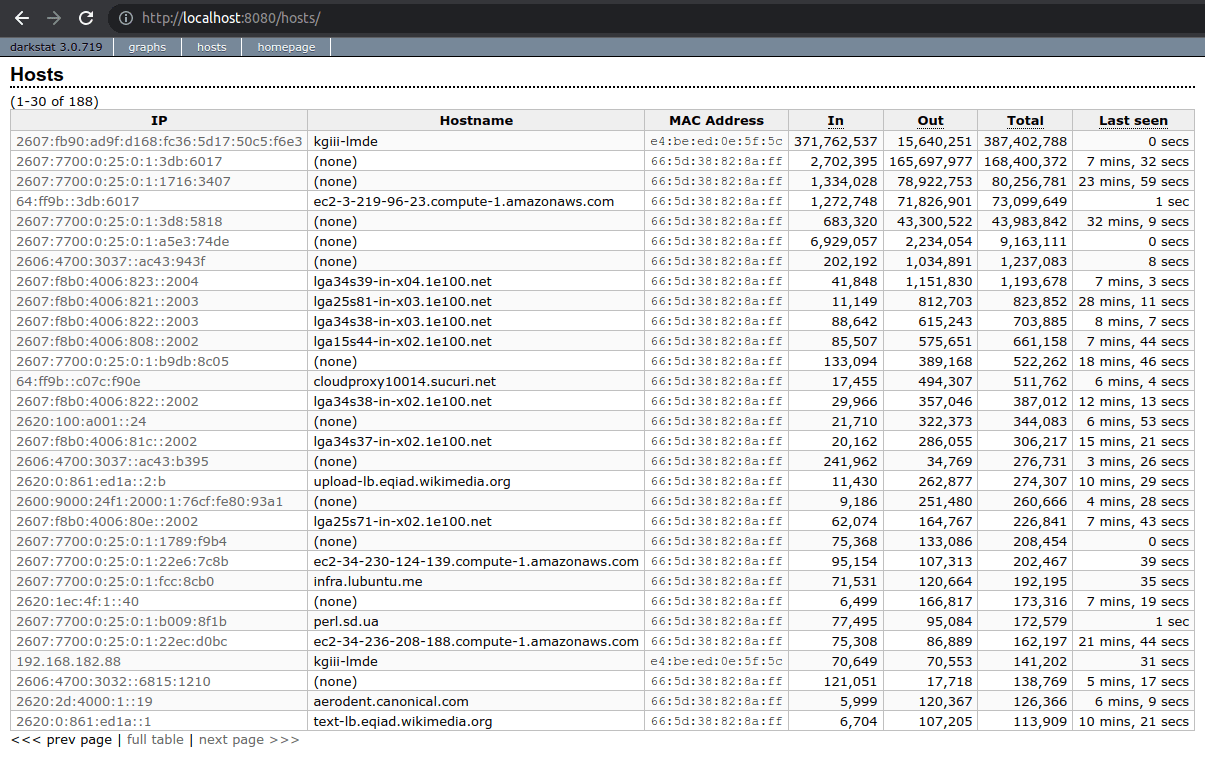
You can also opt to see the hosts, those servers you’ve connected to, by simply clicking on the ‘hosts’ link. That’d look something like:
The darkstar application will run quietly in the background. It’ll keep running until you tell it not to. One way to kill darkstat would be:
1 | sudo killall -9 darkstat |
As I mentioned above, darkstat has a number of different options. There’s a bunch more to it, but this is about all your regular user will need to visualize their network traffic. Of course, run man darkstat to view those options.
Closure:
There you go. You have another article, this one less short than the recent articles. I am not well, but I presume I will be. In the mean time, we’ll continue to have articles for as long as I’m able. This time, we learned about how you can visualize your traffic with darkstat. Who knows what the next article will be about.
Thanks for reading! If you want to help, or if the site has helped you, you can donate, register to help, write an article, or buy inexpensive hosting to start your own site. If you scroll down, you can sign up for the newsletter, vote for the article, and comment.