Today’s article is going to be fairly brief and easy, as it just covers how to find your username in Linux. For this exercise, we’ll be using a terminal and some basic commands. It shouldn’t be too stressful or difficult. In fact, it should be just the opposite.
When you open your terminal, you’re usually greeted with some information. In that information is typically your username. However, it’s possibly that this is no longer true. You could have it display anything you wanted, plus there’s a chance you’re logged in remotely and just can’t remember which terminal window is connected to which device.
So, there are some reasons why these commands exist. I mean, you should probably know your username. That’s not the kind of thing I forget, but I am getting older. Still, the commands exist and must exist for a reason.
My motto is that they wouldn’t have provided a path if they didn’t want you to get to the destination. (That’s not really my motto.) So, if there’s a command that’ll help you find your username in Linux, you might as well know it and know how to use it.
Find Your Username In Linux:
This article requires an open terminal, like many other articles on this site. If you don’t know how to open the terminal, you can do so with your keyboard – just press
With that terminal open, let’s try echoing the $USER variable. It’s nice and easy, and it looks like this:
1 | echo $USER |
You can also use who and whoami as commands:
1 | who |
And:
1 | whoami |
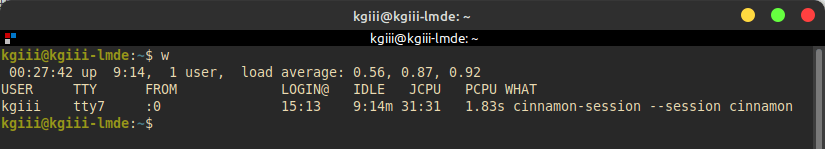
There’s also w, which shows logged in users – so you may be able to deduce your username from that list. It just looks like a:
1 | w |
The ‘w’ command nice and handy, and has a bit more information about the user. It would look similar to this:
As you can see, there are a number of ways. I’m sure that I’m missing some. Feel free to chime in and add to the list. Basically, if you want to share it with the world, leave a comment. Otherwise, many readers know where to find me.
Closure:
And now you have another article. This one isn’t fancy, nor is it something you’re going to need all the time. However, it’s still a very basic and useful tool to add to your Linux toolbox. Things like these are the fundamentals. How to find your username in Linux is an absolute beginner move and a move that leads you forward to more knowledge.
Thanks for reading! If you want to help, or if the site has helped you, you can donate, register to help, write an article, or buy inexpensive hosting to start your own site. If you scroll down, you can sign up for the newsletter, vote for the article, and comment.