Better Network Diagnostics With MTR

This article will show you how to get better network diagnostics with MTR, a tool called “My Traceroute” that combines both traceroute and ping into a single tool. MTR is a pretty handy tool that’s likely installed by default and a tool that even regular users should have in their toolbox.

You may remember that I wrote an article about traceroute. If you don’t know what traceroute is, it’d be in your best interest to go read that article, as I will not really be duplicating the work that went into writing that article.

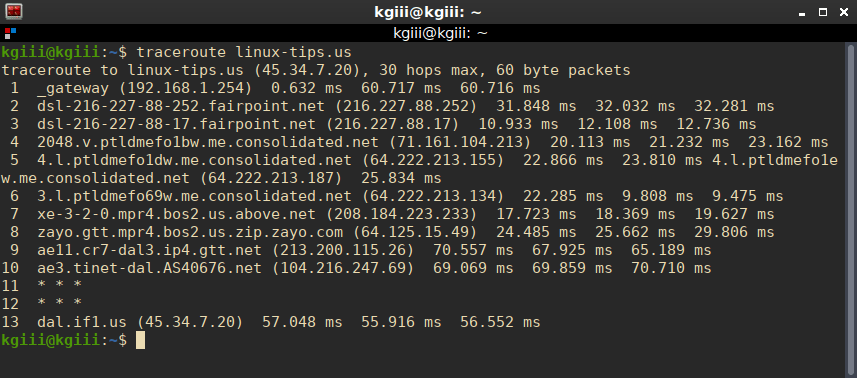
As of yet, I have not yet written an article about ping. Ping is a terminal-based tool, used to time how long it takes for your device to send and receive packets to and from another device. It’ll also tell you if there are packets being dropped along the way. You can use it pretty easily. Here’s a very basic ping command:

(You can use CTRL + C to stop the running process.)

The output from that command is pretty self-explanatory. The numbers you’re probably most interested in are all the way on the right, and denote how long it took for a round-trip message to complete in milliseconds. Online gamers are often interested in their ping times. This is because a higher ping may mean they may lag behind their competitors. In this case, lower is better.

Well, MTR combines the two, traceroute and ping. It’s pretty awesome. You’ll see!

Network Diagnostics With MTR:

So long as you understand both ping and traceroute, there’s not much more this article can teach you. MTR is pretty basic in its output, easily understood by all but the novice users. Anyone with any networking history will immediately grasp the importance of MTR.

MTR isn’t a new tool, having been around since 1997. I won’t be covering how to install it. MTR’s likely already installed. If not, it’ll be easy enough to install it. If anything, this article is largely just an excuse to make people aware of it.

This article requires an open terminal. If you don’t know how to open the terminal, you can do so with your keyboard – just press CTRL + ALT + T and your default terminal should open.

Now, with your terminal open, try:

It should look something like this:

mtr in action
I really don’t need to explain the columns, do I? I’m sure you can figure it out!

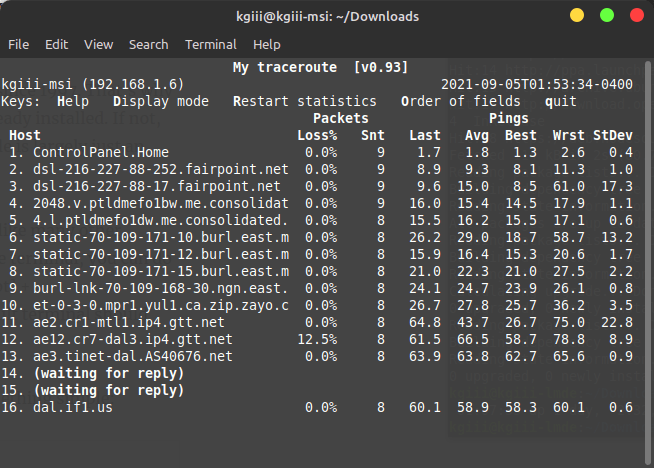
There’s some options while it is running. The H, D, R, O, and Q keys all have functions, listed right there after “Keys:”! There are a few options when starting MTR, a whole lot of options. You can find those options by running man mrt. I’ll cover a couple of interesting options here.

If you want to limit the number of pings, you use the -c flag and then add the number. In the example below, I have chosen 5.

You can also just show IP addresses, not resolving the hostname. Like so:

If you want to show both IP addresses and resolved hostnames, the flag is -b.

There’s more that you can do with it, but mostly you can use it to find where along the line the traffic stops. If it’s on your end, you get to do something about it. Otherwise, I suppose you’re at the whim of the MITM. So, give the man pages a look and let me know in a comment if you already use this tool and how you use it.

Closure:

And there’s another article. Woohoo! It’s not just another article, but it’s an article about doing network diagnostics with MTR. It’s not as hard as one might think to come up with ideas for articles. Sometimes, I just use a tool and then realize it may make for a good article. That’s what happened in this case.

Thanks for reading! If you want to help, or if the site has helped you, you can donate, register to help, write an article, or buy inexpensive hosting to start your own site. If you scroll down, you can sign up for the newsletter, vote for the article, and comment.

‘traceroute’ in Linux, Let’s Take a Closer Look!

This article will explain a little about ‘traceroute’ as a network diagnostic application. We’ll give a few traceroute examples, enabling you to figure out some networking issues.

Whenever I find myself unable to connect to a networked device, including websites online via the internet, one of the first tools I reach for is called ‘traceroute’. It’s not exclusive to Linux and you may know of the tool ‘tracert’ in Windows that does the same thing.

traceroute defines itself as this:

traceroute – print the route packets trace to network host

More realistically, it shows you the hops (devices) you go through in order to make a connection. See, when you connect to a different computer over the network, you don’t generally do so without going through other devices. Your data will travel through multiple devices to reach the source device and all those hops along the way are potential points of failure.

Sometimes those devices are under your control and you can actually do something about it. Other times, it’s just informative and all you can do is wait, or inform someone else and hope they fix it. If nothing else, you’ll know where your packets stopped or slowed down to the point of uselessness.

For example, there 13 hops (devices) between me and linux-tips.us.

traceroute in action
See? There are 13 hops to reach my destination. 

So, while that picture should explain it well enough, let’s get a little deeper.

Using traceroute:

You may find that traceroute isn’t already installed. If it isn’t, it’s absolutely in your default repositories. However you would normally install software is how you install this. If you look, traceroute is sure to be in there. So, go ahead and install it if it’s not already installed. For example:

Just adjust that to your package management system and it’ll be in there. It’s that important a tool that I’m sure it’s in there. In fact, I’m a bit surprised that it’s not always installed by default, but it isn’t.

Now, the most basic usage is just like you saw in the image above.

So long as you’re within 30 hops and use 60 or fewer packets, that’s going to work well enough. The information it spits out is what devices it has traveled through (their hostname and IP address) and RTT – Round Trip Times. There are three of them because three packets are sent. Ideally, you’ll see your destination listed last. If not, you’ll see the closest you got to your destination.

If you see an asterisk, that means the device didn’t respond as expected. Frequently, this means the device is blocking ICMP. You can try to get around this by using ICMP ECHO (-I) or TCP (-T) packets. However, both of those will require elevated permissions, or the use of sudo.

All of this is mostly informative – unless you’re in control of the network and devices.

When it’s a network and devices under your control, you can use this information to troubleshoot. You can see the device names and time taken for packet transit, narrowing down your choices for troubleshooting.

When you’re using this over the public internet, you’re subject to other people who control the devices. If you find a break along the way, about all you can do is wait – or maybe use the data to contact your ISP (or hosting provider, if it’s your site that you’re trying to reach).

There are other options with traceroute. You can change the port you use, you can send more or fewer packets, you can not resolve hostnames, and more. To see the rest of the traceroute options:

That will fill you in with the many other choices you have. I find I don’t really need the advanced options, but system admins may need some of the features. As a regular user, I just use it to troubleshoot my own connections on my private network or when I am having web hosting/connectivity issues.

Closure:

And there you have it. Another article is in the books, and this time it’s just a nice easy article about the venerable traceroute. If you don’t already have this tool in your toolbox, it’d be worth adding and adding a basic familiarity to your mental toolbox.

Thanks for reading! If you want to help, or if the site has helped you, you can donate, register to help, write an article, or buy inexpensive hosting to start your own site. If you scroll down, you can sign up for the newsletter, vote for the article, and comment.

Subscribe To Our Newsletter
Get notified when new articles are published! It's free and I won't send you any spam.
Linux Tips
Creative Commons License
This work is licensed under a Creative Commons Attribution 4.0 International License.