Demystifying journalctl: A Comprehensive Guide to Linux System Logging

It was suggested that I write an article about journalctl, which seemed like a large topic. I decided that I’d let AI have a shot at it, so this article was written by ChatGPT.

It took a few prompts to get what I wanted – which turned out to be the first result. I gave the AI the chance to rework the article but the result was that I much preferred the initial offering. After all, I was only after a very light overview of the journalctl command. 

There’s a lot to the journalctl command. The journalctl command is far too much to cover in a single article. Heck, I don’t even know some aspects of the command. You can see this by checking the man page with the following command:

See? There’s a lot to the command. At the end of the day, AI did a good job of summing up what you really need from the command as an average user. So, I’m going to go ahead and publish that content. It did a better job than I’d have done!

Introduction To journalctl:

In the realm of Linux system administration, understanding and managing system logs is indispensable. Logs provide crucial insights into the health, performance, and security of a system. Among the plethora of tools available for log management, journalctl stands out as a powerful and versatile command for accessing and analyzing logs in systems utilizing systemd. In this comprehensive guide, we will delve into the intricacies of journalctl, exploring its features, functionalities, and practical applications.

Understanding Systemd Journal:

Systemd, the init system adopted by many modern Linux distributions, introduced the systemd journal as a replacement for traditional syslog. The journal, stored in binary format, offers numerous advantages over syslog, including structured logging, faster search capabilities, and enhanced metadata.

journalctl serves as the primary interface for querying and interacting with the systemd journal. It provides administrators with a rich set of options for filtering, displaying, and analyzing log entries, empowering them to effectively troubleshoot issues, monitor system activity, and extract valuable insights.

Basic Usage:

At its core, journalctl allows users to retrieve and view log entries from the systemd journal. The simplest invocation of journalctl displays the entire journal, starting with the most recent entries:

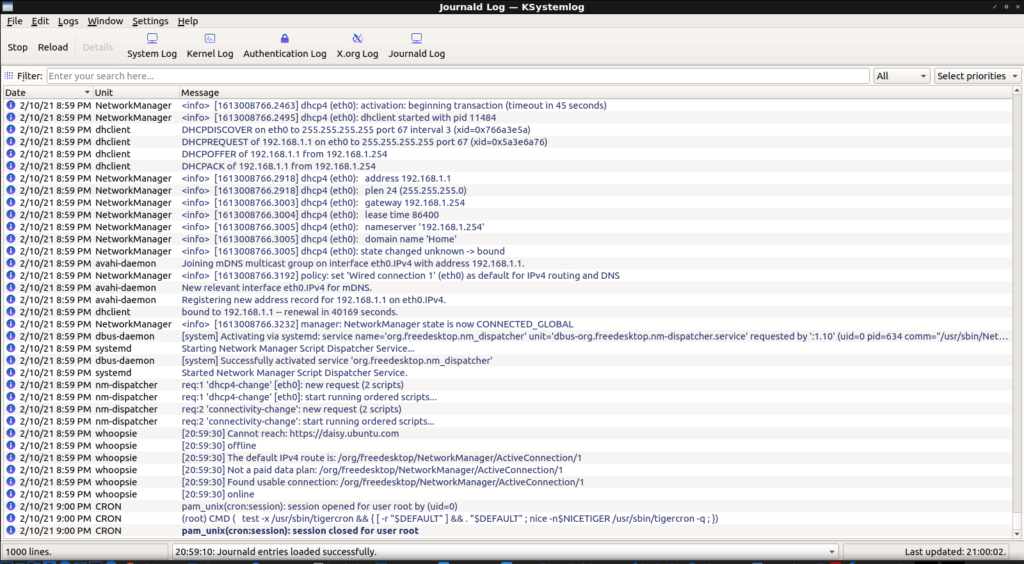
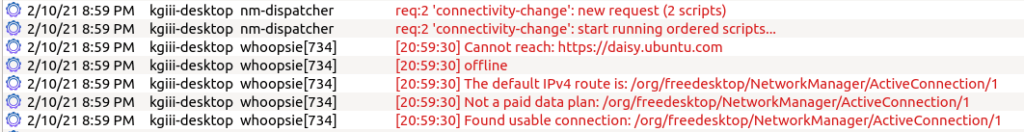
This command presents a paginated output of log entries, including timestamps, log levels, and message contents. By default, journalctl displays logs from the current boot session. However, it also supports options for querying logs from previous boots or specific time ranges.

Filtering and Querying:

One of the key strengths of journalctl lies in its ability to filter log entries based on various criteria. Administrators can narrow down the search results by specifying filters such as time range, log level, systemd unit, or specific fields within log messages.

For example, to display all log entries generated by the sshd service, the following command can be used:

Similarly, to retrieve logs pertaining to a particular time range, the --since and --until options can be utilized:

Additionally, journalctl supports advanced filtering using Boolean expressions, enabling complex queries to be constructed for precise log retrieval.

Output Formatting and Presentation:

journalctl offers flexible options for customizing the format and presentation of log entries. Administrators can choose from various output formats, including short, verbose, and JSON formats, depending on their preferences and requirements.

For instance, to display log entries in a more detailed and verbose format, the -o verbose option can be used:

Moreover, journalctl provides options for controlling the display of timestamps, including the ability to convert timestamps to the local time zone or display them in a human-readable format.

Real-time Monitoring and Follow Mode:

In addition to viewing historical log entries, journalctl can also be used for real-time monitoring of system logs. By invoking journalctl with the -f or --follow option, administrators can tail the journal and receive live updates as new log entries are added:

This feature is particularly useful for monitoring system activity in real time, diagnosing issues as they occur, and tracking the progress of system services during startup and shutdown sequences.

Integration with Other Tools:

journalctl seamlessly integrates with other Linux system administration tools, enabling administrators to combine its capabilities with those of other utilities for more comprehensive log analysis and management.

For example, grep can be used in conjunction with journalctl to perform pattern matching and further refine log queries:

Furthermore, administrators can leverage shell scripting and automation to automate log analysis tasks, extract meaningful insights, and trigger alerts based on specific log patterns or conditions.

Conclusion:

In conclusion, journalctl emerges as a powerful and indispensable tool for managing system logs in Linux environments utilizing systemd. Its rich feature set, flexible filtering options, and real-time monitoring capabilities make it an invaluable asset for system administrators, enabling them to effectively diagnose issues, monitor system activity, and ensure the stability and security of their systems.

By mastering the intricacies of journalctl, administrators can gain deeper insights into system behavior, streamline troubleshooting workflows, and maintain the optimal performance of their Linux infrastructure. Whether it’s debugging a system issue, auditing security events, or analyzing performance metrics, journalctl empowers administrators to navigate the complexities of system logging with confidence and efficiency.

Closure:

Well, I keep finding uses for AI. This is a better article than I’d have written. I think I’ll next use AI for a solid article about grep. That sounds like a reasonable subject and it’s an article that I can reference in many other articles. In fact, I should have done an article about grep already!

So, this is an article about journalctl. It’s an overwhelming command. It’s amazingly complicated and powerful, but you (as a regular user, as most of my readers are) will only need to know the basics. This is indeed the basics and they appear to be well-described.

Thanks for reading! If you want to help, or if the site has helped you, you can donate, register to help, write an article, or buy inexpensive hosting to start your site. If you scroll down, you can sign up for the newsletter, vote for the article, and comment.

View Some Logs In The Terminal

Today we’ll have a relatively simple set of commands that will show you how to view some system logs in the terminal. We’re only going to cover a few of them that are similar in operation. There are far more things that get logged.

You generate logs as you use your computer. These will vary and there are quite a few logs kept. Logs aren’t just kept by the system. Some third-party applications create logs. We’ll only be covering a few system logs. I just want to keep things simple.

The tool we’re using for this exercise is the cat command. The cat application is one tool that lets you read text files in the terminal. It’s a frequently used tool at my house. Hopefully, you too will get comfortable using this command at your house.

It seems like that should be enough of an intro. If you have any questions, you can always leave a comment. Those get seen and addressed more quickly than when you try to contact me elsewhere. (Comments almost instantly send a notification to whatever computer I’m using. They’ll even ping my phone if I turn the notification sound on.)

Anyhow… Ask away, should you have any questions…

View Some System Logs In The Terminal:

We’ll be viewing a few different types of logs. As mentioned above and in the heading, this is something we do in the terminal. You can usually open a terminal by pressing CTRL + ALT + T. If that doesn’t work, you’ll almost certainly find a terminal in your application menu.

First, we’ll view the kernel log.

The kernel is the actual “Linux” in your Linux. The kernel deals with task scheduling, and running processes as needed. It’s an abstraction between you and the hardware.

If you want to view the current kernel log, use this command:

If you want to view the previous session’s kernel logs, use this command:

Both of those commands will flood your terminal. That’s okay, you can use the pipe operator and the less command like so:

Next, we’ll view the boot log.

When you boot your computer, the computer keeps track of what happens during that process. This is known as the boot log. It can be exceptionally handy when you have a problem booting. 

If you want to check the current boot log, use this command:

If you want to check the previous boot log, check it with this command:

Again, you can use a pipe and the less command to manage the flow of data.

Next, we’ll view the system log.

The system logs all sorts of additional information. If you’re not finding the information you want in the previous two logs, checking the system log is prudent. The system logs all sorts of things that are useful for resolving problems.

If you want to check the current system log, use this command:

If you want to check the previous system log, run this command:

Don’t forget that you can use a pipe and less in this command. This will give you a slower output you can manage with your arrow keys.

And that will show you your system log.

That’s all it takes to view the major system logs. There are other logs and we’ll have to cover them at some point.

Closure:

Well, this didn’t take too many words or too much time… That’s nice. If you want to start troubleshooting your own problems, learn to read the system logs. If you don’t want to ask for help, learn to read the system logs. Well, that and learn to read the man pages, but that last bit is outside the scope of this article.

I do hope you enjoyed this article. They’re fun to write but it does sometimes feel like work. I never wanted this to feel like it was work, but here we are. It probably would have been wiser to not set such a schedule and to allow some vacation time in there. This whole project started when I had far more time due to the pandemic.

We do have a special day coming up… You’ll see!

Thanks for reading! If you want to help, or if the site has helped you, you can donate, register to help, write an article, or buy inexpensive hosting to start your site. If you scroll down, you can sign up for the newsletter, vote for the article, and comment.

How To: Free Some Disk Space By Deleting Old Logs

In today’s article, we’re going to free up some of your disk space by deleting old logs. It’s a relatively safe and easy thing to do, and can free some space up if you’re running low. Unless there’s a problem, you really don’t need a bunch of old logs kicking around and taking up space.

There are other reasons for deleting old logs, such as keeping things tidy or even ensuring old activities aren’t easily discovered by browsing old log files. You may have done some debugging and now want to start with a new slate, so there’s another reason to delete logs. 

Who knows what motivations you’ll have, but today we’ll be covering how to do it. The tool we’ll be using for log cleaning is ‘journalctl’, which is used for (according to the man page):

journalctl – Query the systemd journal

While ‘journalctl’ is a pretty nifty tool, we’re only going to scratch the surface. This article is only about deleting old logs and ‘journalctl’ is just the tool we’ll be using. If you want an article about all the features of ‘journalctl’, this is not that article. See? I’m saving at least a few people some time!

Anyhow, this article obviously requires a distro that uses ‘systemd’. If you don’t have ‘systemd’, you probably don’t have ‘journalctl’ and you’ll have to find another way to delete your logs. As most mainstream distros are using ‘systemd’, there’s a pretty good chance that you have ‘journalctl’ available.

So, with all that preamble gibberish out of the way, let’s go about …

Deleting Old Logs:

Like oh so many articles here, this one requires an open terminal. Why? Because of course it does. If you don’t know how to open the terminal, you can do so with your keyboard – just press CTRL + ALT + T and your default terminal should open.

Now, with your terminal open, let’s have a look and see how much space your logs are taking up. You can do that with this command:

Now that you’ve seen how much space your logs are taking up, there are a couple of commands you can use for deleting old logs. If you want to go by space, you can use this command:

You can edit the ‘100m’ to whatever suits your needs. You can also use ‘g’ for gigabytes if you’d like to keep using that much log space.

If you want, you can also delete your old logs by the day. Let’s say you want to retain the last 3 days of logs. Well, that command would be:

I suspect you can figure out that the ‘d’ stands for ‘day’ and the 3 is how many days. You can, of course, change that to any number of days you wish. If you want, you can even use ‘w’ for weeks. Though, if you’re deleting log files to clear up disk space, you’re probably going to want to trim the logs even more than that.

Anyhow, when you’re done running one of the cleaning commands from above, you can verify that the space has been cleaned by running the very first command listed. That will do exactly what it did the first time you ran it – it’ll tell you how much space your logs are taking up. If they’re still not small enough for your liking, feel free to edit and run one of the above commands a second time.

Closure:

Well, there you have it… You have another article! This time I tell you how to go about cleaning old logs from your system. It’s a handy skill to have, though most folks probably have ample disk space – except those running on stuff like Chromebooks or the likes. If you’ve gotta live within 16 GB, you’re going to want to keep your logging to a minimum. Also, I still haven’t skipped a day from writing articles. It seems likely that I’ll do so eventually!

Thanks for reading! If you want to help, or if the site has helped you, you can donate, register to help, write an article, or buy inexpensive hosting to start your own site. If you scroll down, you can sign up for the newsletter, vote for the article, and comment.

How To: Graphically Check Your Logs For Errors With ‘KSystemLog’

Today’s article is going to be about one of my favorite tools for checking the various system logs, KSystemLog. Checking your logs for errors has never been easier, and this is one of the first tools I reach for when I have a problem that I don’t know how to solve.

When you first notice a problem with your Linux box, you might only be noticing the symptoms and not actually seeing the reason. Those reasons can often be found by rooting through the various logs to see what’s actually causing the error.

Back in the early computing days it required the terminal to work with your system’s logs. You’d ask for help on a forum and they’d request that you run a command that looked something like this:

It that actually worked and it worked well enough for a long time. It worked even better when you knew what you were looking for and looking at. If you didn’t, you’d scroll through tons of text in the terminal with no real visual cues to sort through the data. Today, there are better tools for this.

Enter KSystemLog:

Thankfully, there’s KSystemLog. KSystemLog’s man page describes it thusly:

Description: system log viewer
KSystemLog show all logs of your system, grouped by General (Default system log, Authentication, Kernel, X.org…), and optional Services (Apache, Cups,etc, …).
It includes many features to read nicely your log files:
* Colorize log lines depending on their severities

* Tabbed view to allow displaying several logs at the same time
* Auto display new lines logged
* Detailed information for each log lines

Which looks like this:

ksystemlog
KSystemlog UI – The images are old and can’t be expanded due to a sudden bout of laziness.

As you see in the image, KSystemLog is a handy GUI that lets view your various system logs. When you look at the image above, you’ll be able see that one of the lines is a darker blue than the previous lines. This is because it’s a new entry, an event that happened after the application had been opened.

That means you can open KSystemLog and then open the application that’s giving you trouble. Doing it this way will let you see what log entries are made and what errors are thrown as the application is opened and used. Of course, you can always examine the entire log of errors and events. 

Even better, the events in the logs can be color-coded, providing easy visual cues. The events range in color, indicating severity, of from a light gray (normal) to a bright red for emergency-level events. You can even filter and search for events.

error messages in kystemlog
Note the color change for errors.

KSystemLog is a KDE application but pulls in very, very few dependencies. It starts rapidly and will show the installed log files by default. In a pretty default configuration, it finds these:

ksystemlog logs available
Currently available logs on this system. More are available.

Getting KSystemLog:

Assuming you are using a major distro, it’s almost certain to be your default repositories. For example, if you’re using a Debian derivative (Ubuntu, Mint, etc.) then it can be installed by opening the terminal and entering:

Just adjust the above installation command for your distro’s package manager and you should be good to go. If KDE is an option for your distro, then KSystemLog can’t be far behind.

By the way, you don’t have to know what the errors mean. You can just take the logged errors and use them as search terms to help. Just copy and paste, using the errors verbatim, and search! It’s absolutely amazing how many errors can be resolved by doing just that. I’ve personally used this method to troubleshoot so many times that I’ve decided that it’s a tool we all need in our Linux toolbox.

Closure:

And there you have it, another article. This one is about KSystemLog, a tool that lets you graphically examine your system’s logs. It’s a great tool for wading through long logs and searching for the root cause of various problems. In an ideal world you’d not need such a tool, but this is not an ideal world. It’s a world with bugs and errors, and KSystemLog is a tool for just that.

Thanks for reading! If you want to help, or if the site has helped you, you can donate, register to help, write an article, or buy inexpensive hosting to start your own site. If you scroll down, you can sign up for the newsletter, vote for the article, and comment.

Subscribe To Our Newsletter
Get notified when new articles are published! It's free and I won't send you any spam.
Linux Tips
Creative Commons License
This work is licensed under a Creative Commons Attribution 4.0 International License.