This is not something everyone is interested in doing but you might as well learn how to disable CPU cores. This is something that’s easily done and easily reversed, so you might as well have an article on the subject.
Why would you do this? Well, maybe you have a low-power project and want to save energy. You may have more CPU horsepower than you need and you prioritize energy use. This might even be something you do to increase the battery life in your mobile devices. Maybe you want to lower the heat output from your CPUs.
There are valid reasons why you might want to disable CPU cores.
It’s just that this isn’t going to apply to most of you. I’d say that 99% of you aren’t going to want to disable your CPU cores.
What are cores? Well, you probably have one single CPU chip in your computer. That computer is then probably broken down into multiple cores. Each core looks like a single CPU to the hardware and operating system.
Of course, each core may also have multiple threads. Threads would also represent themselves as individual cores. If you disable a CPU core, you’ll also disable the threads on that core, if you use a multi-threaded CPU.
NOTE: Moden CPUs may have high-power and low-power CPUs. I have no clue which will be disabled if you follow this article. I don’t have a fancy CPU to test with. You can test and let us know the results! It’s easily reversed. You can add your cores back with no problems.
GRUB:
GRUB is the application we’ll be playing with. I should also mention that GRUB stands for Grand Unified Bootloader and is the default bootloader for most Linux distributions.
GRUB controls how your system boots and GRUB can also give you the option of which operating system to boot if you use a multi-boot system. It’s one of those things that you can modify pretty heavily. You can even modify your boot screen’s appearance when you’re using GRUB.
Trying to access the GRUB man page is interesting. It isn’t your traditional man page and isn’t accessed in the same way. If you want to check the man page, you use this command:
1 | info grub |
If you run that command you’ll see what looks like an index page. That’s because it is an index page. Use your arrow keys to navigate and use the enter button to open a category page. It’s pretty simple to navigate but there’s a whole lot of information there.
If you’re a newbie, you might just want to look and see that info page. Trying any of that out may result in a system you can’t boot. You have been warned. Tinkering blindly with GRUB will eventually break your system unless you know what you’re doing. Not even I understand everything – but that’s true about a lot of things.
This article assumes that you have GRUB and Nano installed.
So, now that you know what we’ll be using, let’s get into the article!
Disable CPU Cores:
If you didn’t figure it out from the ‘Nano’ mentioned above, this is one of those things you do in the terminal. More often than not, you can open a terminal by pressing
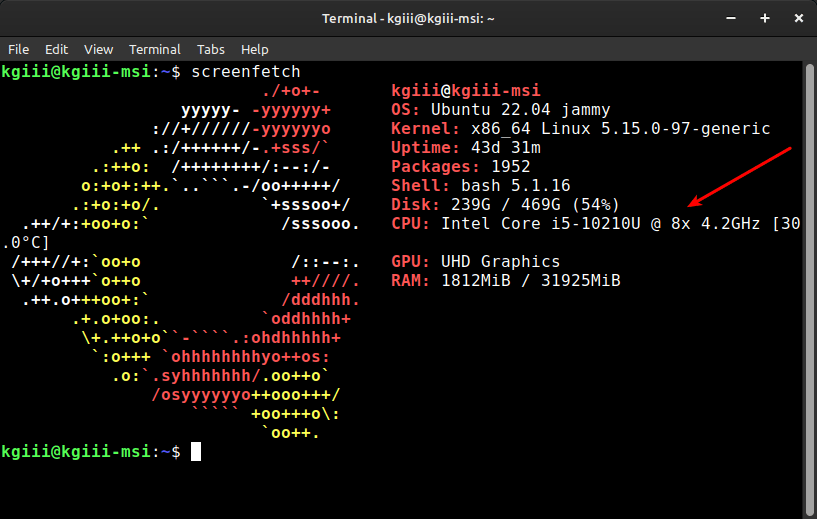
Next, you need to know how many CPUs you have. You should probably already have that information. If you don’t have that information, you can use something like ScreenFetch to find that information. (I used lscpu to find my information, but I’m trying to keep it simple for you.)
Just run this command (once you’ve installed ScreenFetch):
1 | screenfetch |
The output should tell you how many cores you have available. Like so:
The Exercise Itself:
Now that you know how many cores you have, you can modify GRUB.
1 | sudo nano /etc/default/grub |
Find the following line:
1 | GRUB_CMDLINE_LINUX_DEFAULT="quiet splash" |
Change that line to something like this:
1 | GRUB_CMDLINE_LINUX_DEFAULT="quiet splash maxcpus=<number>" |
As you saw above, this system has 8 CPUs listed. Let’s say I wanted to cut that in half, perhaps to save battery life while I’m on a trip and not doing any computationally heavy tasks. I’d change that line to match this:
1 | GRUB_CMDLINE_LINUX_DEFAULT="quiet splash maxcpus=4" |
Now that you’ve made the edit, you need to save the file. As you’re using Nano for this, you save files by pressing
The next step is to update GRUB, telling GRUB to reconfigure itself because you’ve changed some of the information. This step is essential but simple.
1 | sudo update-grub |
Next, you reboot the system for the changes to take effect:
1 | sudo reboot |
When you next open your system, run screenfetch again to confirm that you’re using fewer cores and that you’re using the number of cores you specified.
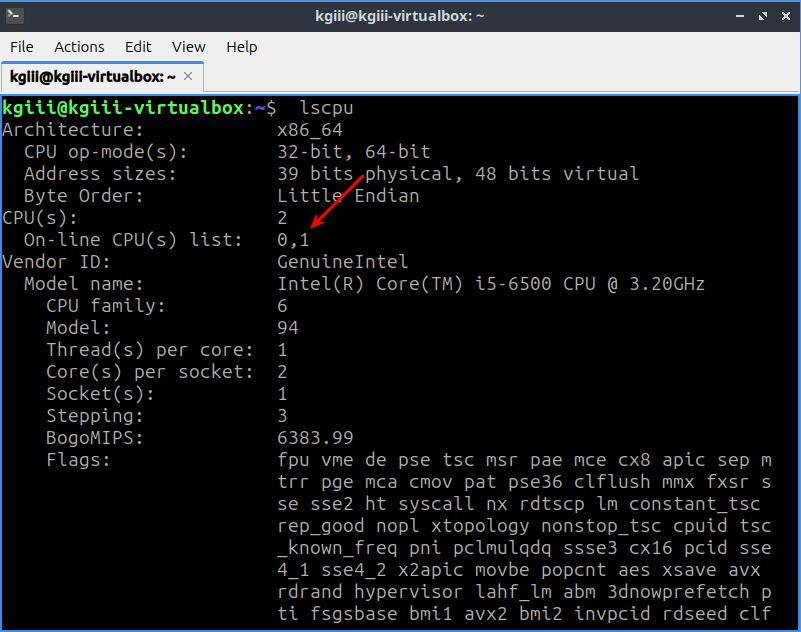
I did this in a virtual machine with 2 CPUs. This was done to confirm that it works and to provide you with some screenshots. When I did so, I did so with lscpu and not ScreenFetch. I hadn’t thought of ScreenFetch and I’d already taken the screenshots. So, that’s what you get.
The Results:
The original configuration:
After the change:
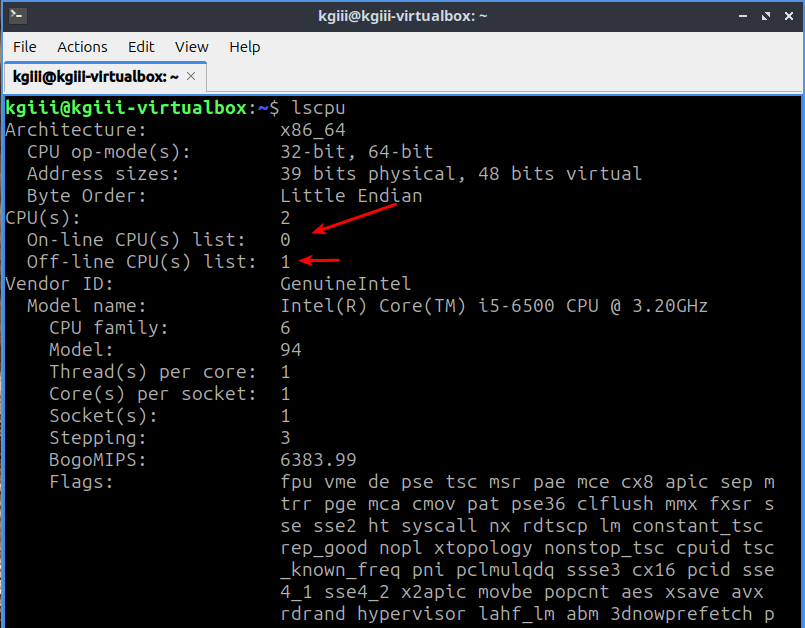
As you can see from the screenshots (again, taken in a virtual machine), it’s easy enough to disable CPU cores in Linux. Well, assuming you’re using GRUB… I’m sure it’s possible with other bootloaders but I don’t have any real experience with them in the memorable past. I’ve used GRUB, more or less exclusively, for quite some time.
If you want to undo this change, or if you want to change the CPU cores to some other number, just remove or edit the added text. If you do that, be sure to run sudo update-grub again to ensure that your changes take effect. If you don’t remember to do that, any changes made will be lost. So, it’s important to update GRUB when you’ve changed any of the information – not just this information.
Closure:
Well, I’m not sure how many Linux users are going to want to change their CPU cores to a lower value. It was in my notes and seemed like a fine article to share with you. I can see doing this in a few instances, such as when you want to save power. Of course, modern operating systems are pretty good at saving power on their own, but it’s still something one might consider.
If you have any other reasons as to why one might want to disable CPU cores, leave a comment. I’m a bit curious. I’d probably do it if I needed longer battery life while on the road or something. I don’t do too many computationally heavy tasks these days. So, I could get away with it on some systems.
Also, this is from my notes. My notes predate the modern CPUs. Quite literally, I have no idea how this will work on systems that have cores that are different, such as high-power and low-power cores. Feel free to test and let me know what you learn. Again, leave a comment. I promise I won’t share your information with anyone and I’ll never send you an email you didn’t ask for.
Thanks for reading! If you want to help, or if the site has helped you, you can donate, register to help, write an article, or buy inexpensive hosting to start your site. If you scroll down, you can sign up for the newsletter, vote for the article, and comment.
Seeing as you’re here, why not visit our friends at Blunix?
“Blunix GmbH offers Debian and Ubuntu focussed Linux Emergency Support 24/7, Project-based Linux Consulting, FOSS-based Managed Hosting on your company IaaS provider account as well as custom Training and Workshops. We prioritize fair business partnerships and employee quality of life over profit. We focus on reasonable security by default and encourage your employees and developers to keep things secure enough to avoid 99% of security issues with automated attack vectors. We focus exclusively on this and do partner with other companies to refer customers that do not fit exactly what we do, or where we require additional help (for example we have a security-focused company that we partner with for higher risk factor hosting setups).”
Click to visit Blunix GmbH.