There are many tools for showing your hardware information and today we’ll get to view detailed hardware information. This is going to work in a variety of distros, so you probably won’t be left out.
We’ve covered many ways to view hardware information, be it all of the hardware or just some particulars. For example:
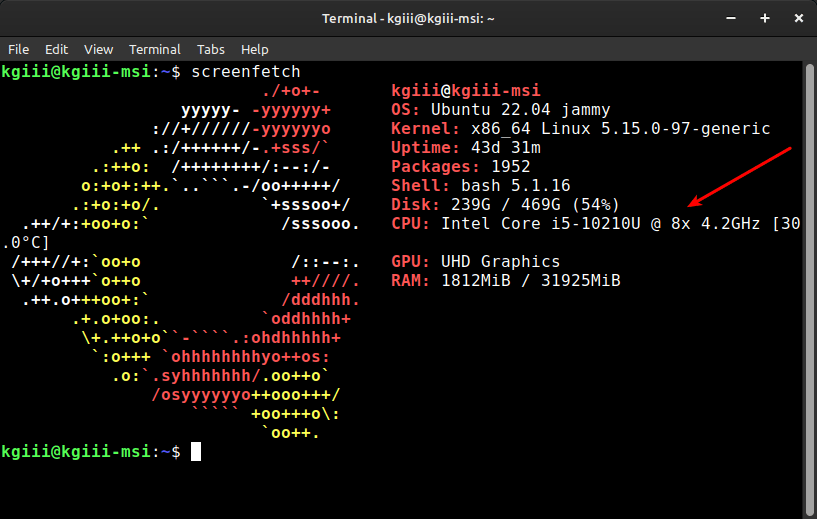
How To: Find Your CPU Information
Show RAM Information With Ramfetch
Let’s Install INXI
Find Your Graphics Card Information
Gather Storage Disk Information With ‘smartctl’
The list goes on and on and on… After all, knowing about your hardware is an important step in a lot of your activities. If you don’t know what you have for hardware, you’re quite limited in the steps you can take. You need to know that your system supports 64-bit to install some distros, for example.
So, today we’re going to examine another way of learning about your hardware. We’ll be doing this in the terminal and we’ll be doing it with a tool known as ‘hwinfo’. It’s a handy application that’s available nearly universally.
hwinfo:
You’ll find that hwinfo is a terminal-based (CLI) tool. If you look at the title of the application you can surmise its function – and it’s very much fit for function.
We’ll get to installing hwinfo, but you can see hwinfo is already installed with the following terminal command:
1 | which hwinfo |
If it is installed, the output should look like this:
1 2 | $ which hwinfo /usr/sbin/hwinfo |
If it’s not installed, we’ll get to that in the next section.
Once installed, you can check the man page with this command:
1 | man hwinfo |
There, you’ll see that hwinfo is fit for purpose. It’s described as:
hwinfo – probe for hardware
There’s also this blurb:
hwinfo is used to probe for the hardware present in the system. It can be used to generate a system overview log which can be later used for support.
So, you can see that this is indeed a good tool for showing detailed hardware information in the terminal. There are other such tools, but we’ll just be covering hwinfo in this article. There will be other articles and have been other articles. This is one of those subjects you’ll see more than once because there’s always more than one way to learn about your hardware.
View Detailed Hardware Information:
I mentioned that this is a terminal-based application. There are GUI tools but this is not one of them. Most of you can open a terminal by pressing
With your terminal open, you can install hwinfo easily.
Debian/Ubuntu/etc:
1 | sudo apt install hwinfo |
Arch/Manjaro/etc:
1 | sudo pacman -S hwinfo |
RHEL/Fedora/etc:
1 | sudo yum install hwinfo |
Gentoo/etc:
1 | sudo emerge -a sys-apps/hwinfo |
SUSE/OpenSUSE/etc:
1 | sudo zypper install hwinfo |
Once you’re done with installing hwinfo, you can ‘just run it’ like so:
1 | hwinfo |
As you can see, that’s rather overwhelming. You could use grep, but there are many flags you can use to make this information more useful. If you check the man page (with man hwinfo) you’ll see this:
all, arch, bios, block, bluetooth, braille, bridge, camera, cdrom, chipcard, cpu, disk, dsl, dvb, fingerprint, floppy, framebuffer, gfxcard, hub, ide, isapnp, isdn, joystick, keyboard, memory, mmc-ctrl, modem, monitor, mouse, netcard, network, partition, pci, pcmcia, pcmcia-ctrl, pppoe, printer, redasd, reallyall, scanner, scsi, smp, sound, storage-ctrl, sys, tape, tv, uml, usb, usb-ctrl, vbe, wlan, xen, zip
Those are all the available flags. The syntax is simple:
1 | hwinfo --flag |
So, you could run this command to learn about your CPU:
1 | hwinfo --cpu |
The output from that is still more information than most folks are going to want. That information is there for those who need it. For everyone else, there’s the --short flag. That works like this:
1 | hwinfo --short --flag |
In the case of the CPU, the command would look like this:
1 | hwinfo --short --cpu |
You can quickly get a list of all the flags (as you may not remember them all) with the following command:
1 | hwinfo -all |
Note that this is different from the --all flag which will display everything.
Closure:
Well, there you have it… You now know how to view detailed (and less detailed) hardware information, you get a choice with hwinfo. You can view detailed hardware information or you can use the flag to show just a summary. Use hwinfo according to your needs and enjoy it!
This seemed like a fine article to write. It’s a pretty basic application but it does have some useful output. It’s worth installing hwinfo just for when you need it, rather than waiting for when you need it and installing it then. That way the tool is read and waiting for you and one less step when you need support or trying to resolve a bug on your own.
Thanks for reading! If you want to help, or if the site has helped you, you can donate, register to help, write an article, or buy inexpensive hosting to start your site. If you scroll down, you can sign up for the newsletter, vote for the article, and comment.
Seeing as you’re here, why not visit our friends at Blunix?
“Blunix GmbH offers Debian and Ubuntu focussed Linux Emergency Support 24/7, Project-based Linux Consulting, FOSS-based Managed Hosting on your company IaaS provider account as well as custom Training and Workshops. We prioritize fair business partnerships and employee quality of life over profit. We focus on reasonable security by default and encourage your employees and developers to keep things secure enough to avoid 99% of security issues with automated attack vectors. We focus exclusively on this and do partner with other companies to refer customers that do not fit exactly what we do, or where we require additional help (for example we have a security-focused company that we partner with for higher risk factor hosting setups).”
Click to visit Blunix GmbH.