In a previous article, I wrote about TeamViewer, and this article will teach you how to restart TeamViewer from the terminal. The reality is, I like TeamViewer quite a bit but it has a nasty habit of failing during the authentication step.
The only way to make it work, without visiting the device in person, is to restart it. I actually do this with SSH, but it’ll work in the terminal. So, you’re doing it from the terminal – you’re just doing it remotely and using SSH to do that.
Well, no… I have no idea how you’ll be doing it. After all, you might choose to do it locally – where this will also work. So, is it really from the terminal? Yes. It just depends on which terminal, I suppose!
Anyhow, this is just a short article. If you’re physically at the computer, why are you using TeamViewer?!? If you’re physically at the computer, you can just restart it with the GUI – or you can use the terminal.
Restart TeamViewer From The Terminal:
So, if you’re at the device, just open the terminal. If you’re not at the device and TeamViewer isn’t authenticating, just connect to it with SSH. We’ll assume you’ve already set up SSH and know how to connect. If you don’t, then go back and read the SSH link in the 2nd paragraph. You need to use the following commands.
To stop the TeamViewer service, run:
1
sudo teamviewer --daemon stop
To restart the TeamViewer service, run:
1
sudo teamviewer --daemon start
If you want to just run one command, you can do that too! Just run:
1
sudo teamviewer --daemon restart
The latter command is probably the easiest, and TeamViewer fails often enough for me to have taken the time to alias the restart command. As far as I can tell, there’s no rhyme or reason for it to no longer authenticate, but that’s what happens.
Closure:
As I use it often enough, I figure this is worth sharing with the world. It’s not a very long article, but it is indeed an article. Hopefully this helps someone who’s having similar authentication errors. As near as I can tell, just restarting the service fixes it and I’d say that the authentication fails every other day, sometimes more and sometimes less. Thanks for reading!
Thanks for reading! If you want to help, or if the site has helped you, you can donate, register to help, write an article, or buy inexpensive hosting to start your own site. If you scroll down, you can sign up for the newsletter, vote for the article, and comment.
This article will show you how to get better network diagnostics with MTR, a tool called “My Traceroute” that combines both traceroute and ping into a single tool. MTR is a pretty handy tool that’s likely installed by default and a tool that even regular users should have in their toolbox.
You may remember that I wrote an article about traceroute. If you don’t know what traceroute is, it’d be in your best interest to go read that article, as I will not really be duplicating the work that went into writing that article.
As of yet, I have not yet written an article about ping. Ping is a terminal-based tool, used to time how long it takes for your device to send and receive packets to and from another device. It’ll also tell you if there are packets being dropped along the way. You can use it pretty easily. Here’s a very basic ping command:
1
ping linux-tips.us
(You can use CTRL + C to stop the running process.)
The output from that command is pretty self-explanatory. The numbers you’re probably most interested in are all the way on the right, and denote how long it took for a round-trip message to complete in milliseconds. Online gamers are often interested in their ping times. This is because a higher ping may mean they may lag behind their competitors. In this case, lower is better.
Well, MTR combines the two, traceroute and ping. It’s pretty awesome. You’ll see!
Network Diagnostics With MTR:
So long as you understand both ping and traceroute, there’s not much more this article can teach you. MTR is pretty basic in its output, easily understood by all but the novice users. Anyone with any networking history will immediately grasp the importance of MTR.
MTR isn’t a new tool, having been around since 1997. I won’t be covering how to install it. MTR’s likely already installed. If not, it’ll be easy enough to install it. If anything, this article is largely just an excuse to make people aware of it.
This article requires an open terminal. If you don’t know how to open the terminal, you can do so with your keyboard – just press CTRL + ALT + T and your default terminal should open.
Now, with your terminal open, try:
1
mtr linux-tips.us
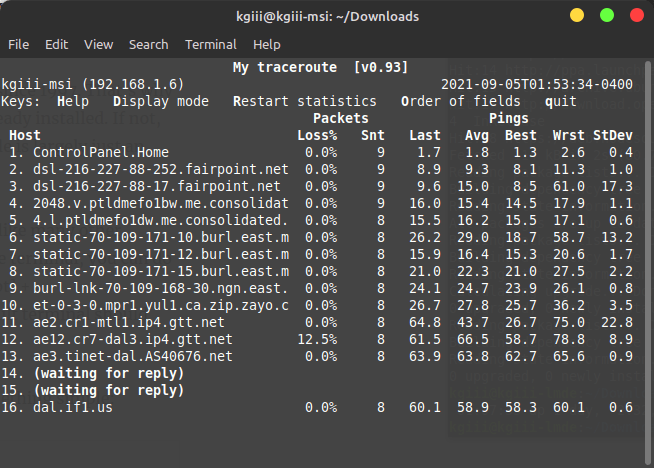
It should look something like this:
I really don’t need to explain the columns, do I? I’m sure you can figure it out!
There’s some options while it is running. The H, D, R, O, and Q keys all have functions, listed right there after “Keys:”! There are a few options when starting MTR, a whole lot of options. You can find those options by running man mrt. I’ll cover a couple of interesting options here.
If you want to limit the number of pings, you use the -c flag and then add the number. In the example below, I have chosen 5.
1
mtr -c 5 linux-tips.us
You can also just show IP addresses, not resolving the hostname. Like so:
1
mtr -n linux-tips.us
If you want to show both IP addresses and resolved hostnames, the flag is -b.
1
mtr -b linux-tips.us
There’s more that you can do with it, but mostly you can use it to find where along the line the traffic stops. If it’s on your end, you get to do something about it. Otherwise, I suppose you’re at the whim of the MITM. So, give the man pages a look and let me know in a comment if you already use this tool and how you use it.
Closure:
And there’s another article. Woohoo! It’s not just another article, but it’s an article about doing network diagnostics with MTR. It’s not as hard as one might think to come up with ideas for articles. Sometimes, I just use a tool and then realize it may make for a good article. That’s what happened in this case.
Thanks for reading! If you want to help, or if the site has helped you, you can donate, register to help, write an article, or buy inexpensive hosting to start your own site. If you scroll down, you can sign up for the newsletter, vote for the article, and comment.
There are all sorts of reasons why you might want to know your network interface name. It comes in handy with things like ‘vnstat‘, for example. In fact, I wrote an article about changing the network interface name. (There’s sometimes a reason why I write articles in the order I write ’em!)
Like I said, you may want to know this information for other purposes. In your general day-to-day computing, the network interface name is entirely unimportant. As you’ve seen from previous articles, it may come to pass that you need to know the name and this article will explain how to find that.
Anyhow, this one is quick and easy. I’m just going to show you some easy ways to find your network interface name. This should be pretty brief and simple enough.
Your Network Interface Name:
Like oh so many articles, this too requires an open terminal. Sure, there are GUI methods to find your network interface name, but we might as well do it in the terminal. So, use your keyboard and press CTRL + ALT + T. With your terminal open, you can start with:
1
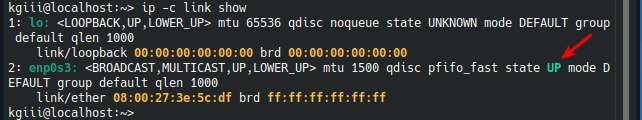
ip -c link show
With any luck, this should be enough. You’ll get something that looks like this:
See the handy arrow? That’ll help! That’s the network interface that’s up and connected.
As you can see by the arrow, that’ll clue you into which connection is in use at the time. If that doesn’t work, you can also try this command:
1
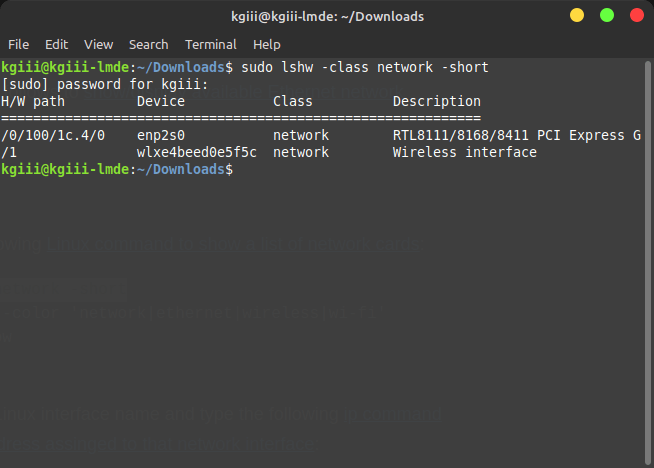
sudo lshw -class network -short
The output from this will look similar to this:
A keen eye will note that there are multiple devices listed!
As you can see, that’s from a different device with a different operating system. It also relies on ‘lshw’ which you may or may not have access to.
You can also try:
1
2
3
4
5
ip -br -c link show
ifconfig -a
ip a
ip addr
ip link show
Some of those commands will show the ‘lo’ connection, which is just a loopback connection and immaterial for this purpose. You can safely ignore that.
Anyhow, those will show you your network interface names. If you have more than one, it’ll happily show them all – and give you a clue as to which one is up. If you have both connected, say wireless and wired, then it will say both are up. This information isn’t very useful by itself, but it is useful for other purposes.
There are other ways, so feel free to leave a comment showing how you find your network interface name.
Closure:
See? I told you this one would be quick and easy. There’s not much to it, but it’s a useful bit of information to know and now you know that this is how you find your network interface name. It’s not much of an article, but it’s yet another in what’s hopefully a long list of ’em! They can’t all be huge pieces!
Thanks for reading! If you want to help, or if the site has helped you, you can donate, register to help, write an article, or buy inexpensive hosting to start your own site. If you scroll down, you can sign up for the newsletter, vote for the article, and comment.
Today, I’m going to review the Dooble browser, so that you don’t have to. The Dooble browser is a browser that has no dependencies as long as your system has fits ‘latest Qt is supported’ requirement. It bills itself as:
Dooble is the scientific browser.
Many folks are aware that I’m a sucker for a new browser. I install browsers that interest me, even though I have no plans to use them as my regular browser. I install browsers just to see what’s going on in the browser world. Changing my browser isn’t actually something I plan on doing!
So, I first read about Dooble browser when I was browsing Reddit. It was some video that I didn’t watch, ’cause I don’t tend click many video links. Seeing a browser name that I didn’t recognize sent me immediately to a search engine, where I found what was once their home page. That, sadly, wasn’t the project’s page anymore. It sent me here.
Technically, the link I clicked sent me straight to the release page where I found it packaged as a .deb file. Being who I am, I immediately downloaded it – with some glee, as it had been a little while since I played with a new browser. It said it was a scientific browser and I’m a mathematician, so I was pretty sure that the browser and I would get along famously.
I was wrong. Oh, was I wrong.
Installing Dooble Browser:
As mentioned, from the releases page, I found the .deb packaged for my Lubuntu system. It downloaded well enough, but the first thing I noticed was this:
1
2
3
4
5
6
7
8
9
10
11
12
13
14
15
16
17
18
19
sudo apt install ./Dooble-2021.08.05_amd64.deb
Reading package lists... Done
Building dependency tree
Reading state information... Done
Note, selecting 'dooble' instead of './Dooble-2021.08.05_amd64.deb'
The following NEW packages will be installed:
dooble
0 upgraded, 1 newly installed, 0 to remove and 0 not upgraded.
Need to get 0 B/97.4 MB of archives.
After this operation, 0 B of additional disk space will be used.
(Reading database ... 476858 files and directories currently installed.)
Preparing to unpack .../Dooble-2021.08.05_amd64.deb ...
Unpacking dooble (2021.08.05) ...
Setting up dooble (2021.08.05) ...
Processing triggers for mime-support (3.64ubuntu1) ...
Processing triggers for gnome-menus (3.36.0-1ubuntu1) ...
Processing triggers for desktop-file-utils (0.24-1ubuntu3) ...
Yes, yes that’s verbatim. I just copied and pasted the output. No, I have no idea why it started off with the selection process like that. I also have no idea why it’d go on to ‘getting’ files. The files were already there. The good news is that it did install and that it was immediately available in the application menu under the Internet heading.
Using Dooble Browser:
So, I opened up Dooble browser and was greeted with what looked like a fairly regular browser. I typed in the address for this site and the site opened, complete with ads.
Curious, I looked for a way to add extensions and found none – more on this later. So, I typed ‘Dooble browser ad block’ into the address bar and pressed the enter button.
Nothing happened.
At this point, I opened a few more sites and decided to open the settings menu. There are like 4 first-level tier buttons that will take you to your browser history… In the settings menu, I found search engines. None of them worked for searching from the address bar. Right clicking on text? Nope… There’s no active ‘search’ feature there.
I found an option to enable ‘web plugins’. This did not enable anything noticable.
I decided to check out the ‘science’ aspect – which is just some sort of mystery graph. To do this, I clicked on ‘Charts’. It helpfully looks like this:
Yes, I pushed the buttons. No, it didn’t help. It wasn’t even remotely helpful.
I have no idea what they’re plotting on the chart. Pressing the buttons didn’t make it clear. I thought about investing some more time, but I don’t like throwing good time after bad.
In my effort to block ads, or at least to see if you could, I played with a feature that let me accept and block domains. I told it to only accept linux-tips.us, and refreshed. It still happily showed me ads from Google. Speaking of which, it’d be pretty sweet if you’d unblock ads on linux-tips.us!
Reviewing Dooble Browser:
Well, it does have an option for a floating clock and floating history. Oh, wait, there’s a 5th way to access history as a top-level option. They sure want you to be able to view your history.
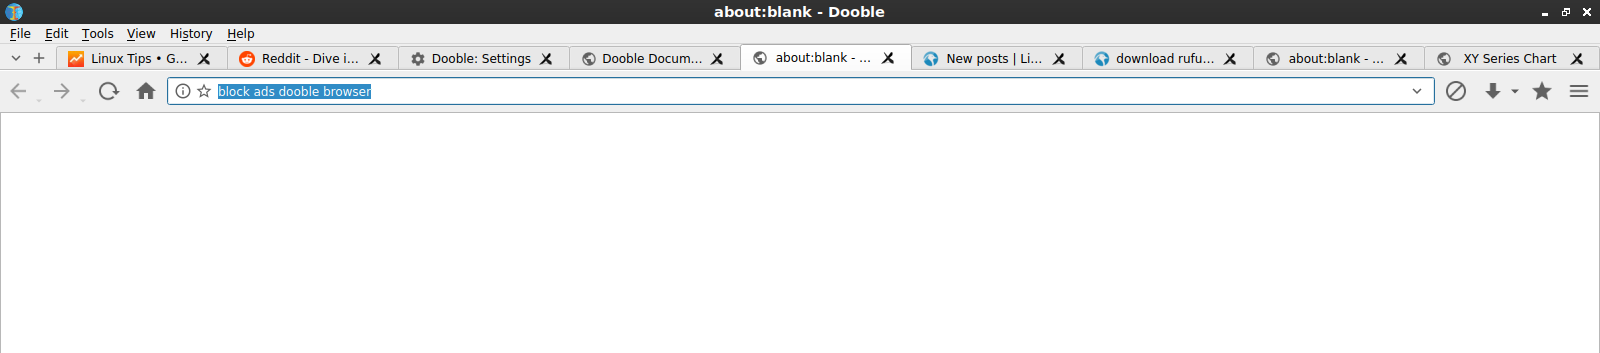
I have no idea why it has ‘search engines’, because there’s no right click search menu and searching from the browser’s address bar does this:
You can just keep clicking and waiting. Nothing happens… You can keep waiting…
Whatever it’s charting, I can’t tell. Usually an X and Y axis actually have labels. Without those, I can’t really tell what is going on. Is it me that’s making the mistakes? Once more, I can’t even tell!
Does it function as a browser? Well… You can technically browse sites. I browsed a number of them before giving up and noticed not one single rendering problem – which is a plus. I was able to login – but my username and password wasn’t remembered, meaning I couldn’t automatically log back in.
One of the things I noticed was that the ‘cache size’ never increased – regardless of how much browsing was done. On the plus side, I told it to not allow Reddit to send push notifications and it appears to have remembered that.
So, on a scale of 1 to 10, I’m gonna give Dooble browser a solid 3.5. It stayed up and running, with no crashes. It didn’t require any dependencies, and installed cleanly. Technically, it does browse websites. The Gopher support amused me, though I didn’t bother testing it.
I find it laughable in its lack of functionality. That it has search features and then doesn’t let you search is amusing. I just can’t give it less than 3.5. I’m sure tons of hours are going into it, and I’ll assume that it’s going to improve. I’ll keep checking in on it. If you’re a developer and would like to offer some sort of rebuttal, I’m all ears.
Closure:
Well… That’s a review. I don’t think I can recommend the Dooble browser to anyone at this time. They have lofty goals but are failing to meet them. When it becomes a usable browser, I’ll try to let people know. I’ll check in on it from time to time, even if just to get a chuckle from how laughably bad it is.
Thanks for reading! If you want to help, or if the site has helped you, you can donate, register to help, write an article, or buy inexpensive hosting to start your own site. If you scroll down, you can sign up for the newsletter, vote for the article, and comment.
Today’s article is going to be about my latest favorite VNC alternative, TeamViewer. It’s a surprisingly handy application that just works. Read on to learn more about it!
I’m a pretty big fan of VNC (Virtual Network Computing, from RealVNC). Actually, it’d be a bit more accurate to say that I’m a pretty big fan of remotely managing devices. Among the ways I do this, VNC is a nice way to do so graphically.
Basically, remote administration software such as this forwards the remote desktop to a window on my local desktop and allows me the control as though I was physically seated at the device. I have quite a few devices, and remotely manage the majority of them. I have computers in my house that I seldom physically use, I manage them all remotely.
SSH is often adequate for anything I want to do, but not always. I can even forward SSH but not all applications work well with that. Sometimes I just want a GUI, as some things are best done in a GUI.
Besides, TeamViewer is free for personal use, and I like TeamViewer because it just works, even over the world wide web without knowing an IP address. I can use it to help friends and relatives by just talking to them long enough to get started.
Frankly, VNC can be a pain in the butt to configure and my favorite VNC client (RealVNC) is proprietary. So, using the proprietary TeamViewer doesn’t bother me.
If you insist on opensource, this isn’t the tool for you. If you want something that is easy and just works, read on:
Getting and Using TeamViewer:
I’ll explain how to install it with Debian/Ubuntu/etc, but you can easily install TeamViewer for other Linux package management systems. Start by opening your terminal by pressing CTRL + ALT + T.
Once open, let’s grab the latest .deb with wget and install it. If you don’t have wget installed, you can do that with sudo apt install wget and then proceed with:
Copy and paste all three of those lines individually, of course. Press ENTER after each one. The last command should complete the process and would normally be the last step but this is proprietary software so you’ll need to run TeamViewer at least once in order to accept the license agreement. You can just do that in the terminal with:
1
teamviewer
That should pop up a window where can accept the license and keep on trucking.
Now, you’ll have to install TeamViewer on each device you want to manage and it’ll need to be installed on any device you wish to use to control the rest. Just be careful and read the prompts. It installs and works like a champ.
You’ll need to configure it on each device as well, allowing remote connections and setting up passwords as needed. It can check a centralized server, so the host doesn’t need to know things like ports and passwords.
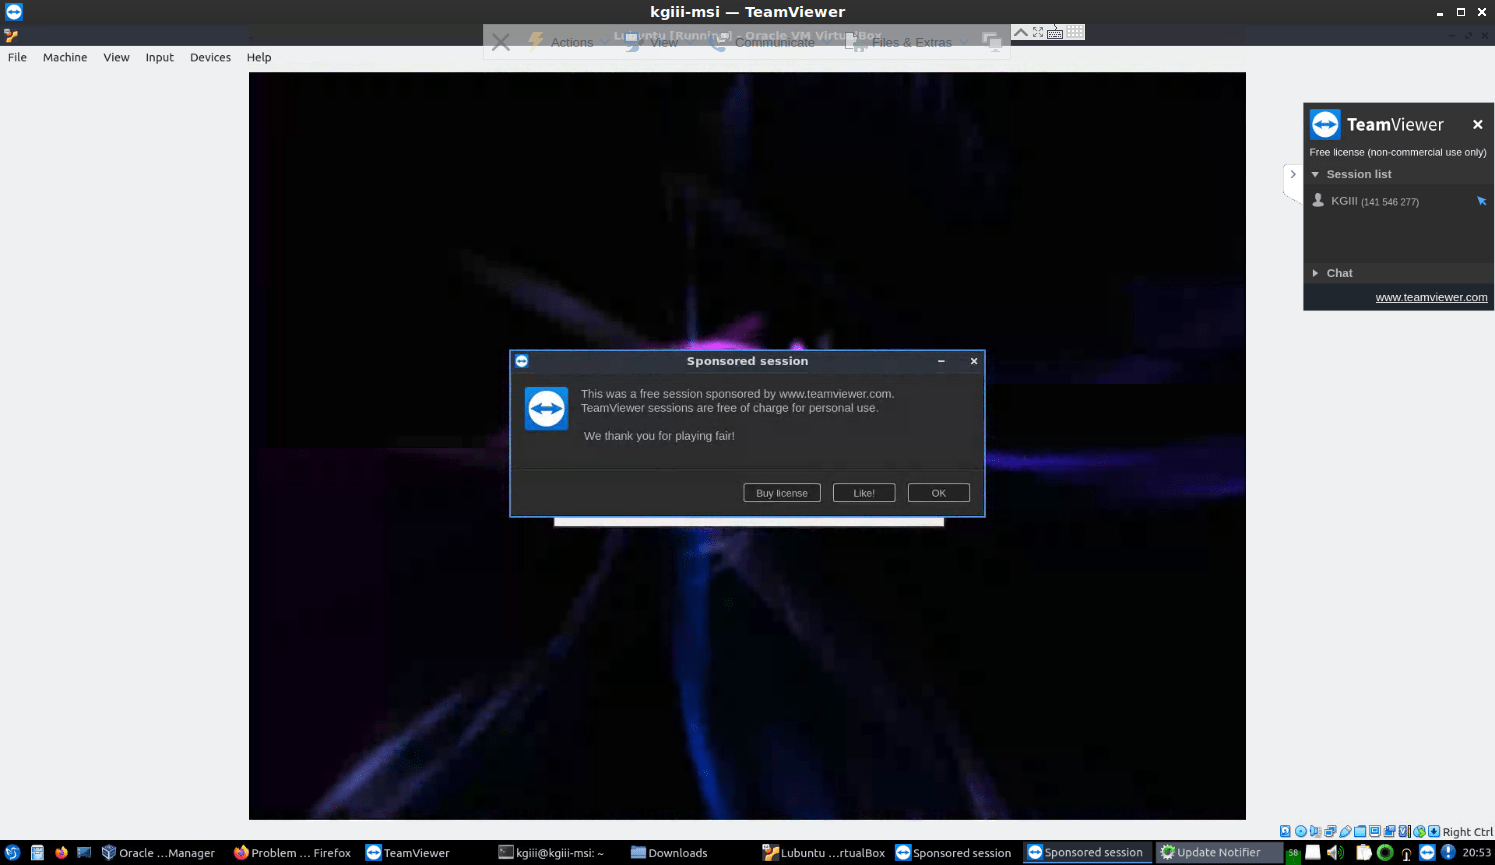
It’s easily configured the first time, and once you’re done it a remote connection will hopefully look a bit like this:
This is what a connection might look like. It’s what mine looks like at this minute in time.
You can use this as a single instance or you can configure an account online with the management console to keep track of all your connections from a single point. You’ll spend a confusing amount of time making your browsers and devices ‘trusted’ status. All of this, of course, has obvious privacy implications.
Privacy & Security Concerns:
Again, they’re absolutely going to track your usage. They’ll know your IP addresses and the names of the devices you’re connecting to. They will know when you connect, how long you stay connected, and more. On top of that, they’ll know your email address, if you give it to them.
Having used them for a while, I see no spam from them and they’ve been nothing but acceptably and professionally behaved from my perspective. I don’t even get any regular newsletter emails from them. I think it’s safe to assume they’re currently not doing so. They do a whole lot of email verification steps if you want to trust devices.
Being proprietary, we have no idea what the source code looks like. We have no way to be sure that they’re not being malicious. They’re a business and they’d do poorly if it turned out they were malicious and using this information for spying or anything of that nature.
If you’re running from an oppressive government, I’d probably not use them. They’re a business and that means they’re likely to respond to lawful requests – and laws around the globe can be pretty terrible.
In fact, if you’re doing anything that’s even remotely secure, I’d suggest not doing so over TeamViewer. Sure, when the application is terminated you can verify that it’s down, but at the same time don’t connect to your remote device to do your banking. That’d just be silly regardless.
As I stated above, I’m quite okay with the potential privacy and security implications. I don’t use Linux because of any philosophical reasons, I use Linux because it just works. If you’re different and object in some way, you should probably just move on and use alternative software to remotely manage your devices.
Closure:
And there you have it! It’s yet another article in the books, another article in the records. Traffic has been high lately, and that’s great. Things are growing in a linear feature and I’m okay with that. Even my Reddit sub is growing – at 50 viewers, up from just a few when I first took the sub over. So, things are going great.
Thanks for reading! If you want to help, or if the site has helped you, you can donate, register to help, write an article, or buy inexpensive hosting to start your own site. If you scroll down, you can sign up for the newsletter, vote for the article, and comment.